Businesses in Kochetok
Hotels & Travel
Industries
Business Distribution by Industry Shopping: 18.8%
Industry: 14.6%
Education: 12.5%
Food: 8.3%
Home Services: 8.3%
Hotels & Travel: 8.3%
Sports & Activities: 6.2%
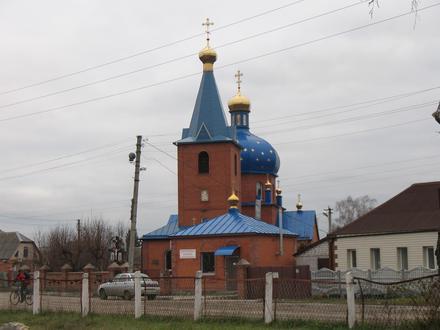
Religion: 4.2%
Restaurants: 4.2%
Postal Services: 4.2%
Financial Services: 4.2%
Other: 6.2%
| Area of Kochetok, Kharkiv Oblast | 2.342 km² |
| Population | 342 |
| Male Population | 158 (46.3%) |
| Female Population | 184 (53.7%) |
| Population change from 1975 to 2015 | +4.3% |
| Population change from 2000 to 2015 | -2.6% |
| Median Age | 40.8 |
| Male Median Age | 36.9 |
| Female Median Age | 44.1 |
| Area Codes | 5746 |
| Local Time | Thursday 6:33 AM |
| Timezone | Eastern European Summer Time |
| Lat & Lng | 49.88005° / 36.73723° |
| Postal Codes | 63513 |
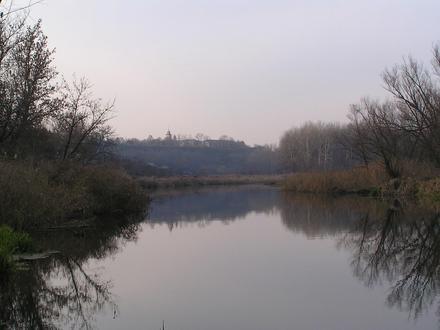
Kochetok, Kharkiv Oblast - Map
Kochetok, Kharkiv Oblast Population
Years 1975 to 2015| Data | 1975 | 1990 | 2000 | 2015 |
|---|---|---|---|---|
| Population | 328 | 362 | 351 | 342 |
| Population Density | 140.1 / km² | 154.6 / km² | 149.9 / km² | 146.0 / km² |
Kochetok Population change from 2000 to 2015
Decrease of 2.6% from year 2000 to 2015| Location | Change since 1975 | Change since 1990 | Change since 2000 |
|---|---|---|---|
| Kochetok, Kharkiv Oblast | +4.3% | -5.5% | -2.6% |
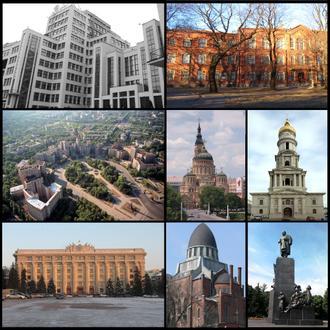
| Kharkiv | -7.2% | -12.6% | -8.1% |
| Ukraine | -8.6% | -13.1% | -8.3% |
Kochetok, Kharkiv Oblast Median Age
Median Age: 40.8 years| Location | Median Age | Median Age (Female) | Median Age (Male) |
|---|---|---|---|
| Kochetok, Kharkiv Oblast | 40.8 years | 44.1 years | 36.9 years |
| Kharkiv | 40.8 years | 44.1 years | 37 years |
| Ukraine | 40 years | 43 years | 36.5 years |
Kochetok, Kharkiv Oblast Population Tree
Population By Age and Gender| Age | Male | Female | Total |
|---|---|---|---|
| Under 5 | 9 | 8 | 17 |
| 5-9 | 7 | 7 | 15 |
| 10-14 | 6 | 6 | 13 |
| 15-19 | 9 | 8 | 18 |
| 20-24 | 13 | 12 | 26 |
| 25-29 | 15 | 14 | 30 |
| 30-34 | 14 | 13 | 28 |
| 35-39 | 13 | 13 | 26 |
| 40-44 | 12 | 12 | 24 |
| 45-49 | 11 | 12 | 24 |
| 50-54 | 12 | 15 | 27 |
| 55-59 | 10 | 14 | 25 |
| 60-64 | 9 | 14 | 24 |
| 65-69 | 5 | 8 | 13 |
| 70-74 | 6 | 11 | 17 |
| 75-79 | 4 | 8 | 12 |
| 80-84 | 2 | 5 | 7 |
| 85 Plus | 1 | 4 | 5 |
Kochetok, Kharkiv Oblast Population Density
Population Density: 146.0 / km²| Location | Population | Area | Population Density |
|---|---|---|---|
| Kochetok, Kharkiv Oblast | 342 | 2.342 km² | 146.0 / km² |
| Kharkiv | 2.7 million | 31,428.6 km² | 85.6 / km² |
| Ukraine | 42.3 million | 574,117.9 km² | 73.8 / km² |
Kochetok, Kharkiv Oblast Historical and Projected Population
Estimated Population from 1200 to 2100Sources:
1. JRC (European Commission's Joint Research Centre) work on the GHS built-up grid
2. CIESIN (Center for International Earth Science Information Network)
3. [Link] Klein Goldewijk, K., Beusen, A., Doelman, J., and Stehfest, E.: Anthropogenic land use estimates for the Holocene – HYDE 3.2, Earth Syst. Sci. Data, 9, 927–953, https://doi.org/10.5194/essd-9-927-2017, 2017.
Human Development Index (HDI)
Statistic composite index of life expectancy, education, and per capita income.Sources: [Link] Kummu, M., Taka, M. & Guillaume, J. Gridded global datasets for Gross Domestic Product and Human Development Index over 1990–2015. Sci Data 5, 180004 (2018) doi:10.1038/sdata.2018.4
Kochetok, Kharkiv Oblast CO2 Emissions
Carbon Dioxide (CO2) Emissions Per Capita in Tonnes Per Year| Location | CO2 Emissions | CO2 Emissions Per Capita | CO2 Emissions Intensity |
|---|---|---|---|
| Kochetok, Kharkiv Oblast | 1,691 tn | 4.95 tn | 722.4 tons/km² |
| Kharkiv | 13,420,666 tn | 4.99 tn | 427 tons/km² |
| Ukraine | 197,794,395 tn | 4.67 tn | 344.5 tons/km² |
Kochetok, Kharkiv Oblast CO2 Emissions
| 2013 CO2 emissions (tonnes/year) | 1,691 tn |
| 2013 CO2 emissions (tonnes/year) per capita | 4.95 tn |
| 2013 CO2 emissions intensity (tonnes/km²/year) | 722.4 tons/km² |
About Our Data
The data on this page is estimated using a number of publicly available tools and resources. It is provided without warranty, and could contain inaccuracies. Use at your own risk. See here for more information.