Businesses in Wobulenzi
Community & Government
Industries
Business Distribution by Industry Education: 76%
Community & Government: 10%
Industry: 6%
Religion: 6%
Other: 2%
| Area of Wobulenzi, Central Region | 19.6 km² |
| Population | 30,519 |
| Male Population | 13,888 (45.5%) |
| Female Population | 16,631 (54.5%) |
| Population change from 1975 to 2015 | +225.4% |
| Population change from 2000 to 2015 | +53.1% |
| Median Age | 16 |
| Male Median Age | 15 |
| Female Median Age | 16.8 |
| Area Codes | 41 |
| Local Time | Wednesday 8:39 PM |
| Timezone | East Africa Time |
| Lat & Lng | 0.72833° / 32.51222° |
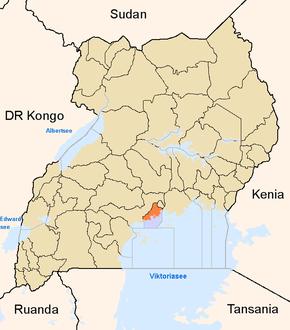
Wobulenzi, Central Region - Map
Wobulenzi, Central Region Population
Years 1975 to 2015| Data | 1975 | 1990 | 2000 | 2015 |
|---|---|---|---|---|
| Population | 9,380 | 14,853 | 19,940 | 30,519 |
| Population Density | 478.5 / km² | 757.6 / km² | 1,017 / km² | 1,556 / km² |
Wobulenzi Population change from 2000 to 2015
Increase of 53.1% from year 2000 to 2015| Location | Change since 1975 | Change since 1990 | Change since 2000 |
|---|---|---|---|
| Wobulenzi, Central Region | +225.4% | +105.5% | +53.1% |
| Luwero | +226% | +101.6% | +51.6% |
| Uganda | +261.4% | +125% | +64.6% |
Wobulenzi, Central Region Median Age
Median Age: 16 years| Location | Median Age | Median Age (Female) | Median Age (Male) |
|---|---|---|---|
| Wobulenzi, Central Region | 16 years | 16.8 years | 15 years |
| Luwero | 15.9 years | 16.8 years | 15 years |
| Uganda | 15.9 years | 16.8 years | 15 years |
Wobulenzi, Central Region Population Tree
Population By Age and Gender| Age | Male | Female | Total |
|---|---|---|---|
| Under 5 | 2,589 | 2,792 | 5,382 |
| 5-9 | 2,314 | 2,564 | 4,878 |
| 10-14 | 2,032 | 2,294 | 4,327 |
| 15-19 | 1,604 | 1,880 | 3,484 |
| 20-24 | 1,200 | 1,619 | 2,820 |
| 25-29 | 941 | 1,258 | 2,200 |
| 30-34 | 745 | 980 | 1,726 |
| 35-39 | 596 | 761 | 1,357 |
| 40-44 | 504 | 618 | 1,123 |
| 45-49 | 370 | 441 | 812 |
| 50-54 | 303 | 413 | 716 |
| 55-59 | 184 | 241 | 425 |
| 60-64 | 158 | 232 | 391 |
| 65-69 | 111 | 156 | 267 |
| 70-74 | 94 | 153 | 248 |
| 75-79 | 56 | 77 | 134 |
| 80-84 | 41 | 77 | 118 |
| 85 Plus | 44 | 75 | 119 |
Wobulenzi, Central Region Population Density
Population Density: 1,556 / km²| Location | Population | Area | Population Density |
|---|---|---|---|
| Wobulenzi, Central Region | 30,519 | 19.6 km² | 1,556 / km² |
| Luwero | 517,494 | 2,219.4 km² | 233.2 / km² |
| Uganda | 39.1 million | 241,384.6 km² | 162.1 / km² |
Wobulenzi, Central Region Historical and Projected Population
Estimated Population from 1740 to 2100Sources:
1. JRC (European Commission's Joint Research Centre) work on the GHS built-up grid
2. CIESIN (Center for International Earth Science Information Network)
3. [Link] Klein Goldewijk, K., Beusen, A., Doelman, J., and Stehfest, E.: Anthropogenic land use estimates for the Holocene – HYDE 3.2, Earth Syst. Sci. Data, 9, 927–953, https://doi.org/10.5194/essd-9-927-2017, 2017.
Human Development Index (HDI)
Statistic composite index of life expectancy, education, and per capita income.Sources: [Link] Kummu, M., Taka, M. & Guillaume, J. Gridded global datasets for Gross Domestic Product and Human Development Index over 1990–2015. Sci Data 5, 180004 (2018) doi:10.1038/sdata.2018.4
Wobulenzi, Central Region CO2 Emissions
Carbon Dioxide (CO2) Emissions Per Capita in Tonnes Per Year| Location | CO2 Emissions | CO2 Emissions Per Capita | CO2 Emissions Intensity |
|---|---|---|---|
| Wobulenzi, Central Region | 9,545 tn | 0.31 tn | 486.9 tons/km² |
| Luwero | 136,357 tn | 0.26 tn | 61.4 tons/km² |
| Uganda | 8,899,307 tn | 0.23 tn | 36.9 tons/km² |
Wobulenzi, Central Region CO2 Emissions
| 2013 CO2 emissions (tonnes/year) | 9,545 tn |
| 2013 CO2 emissions (tonnes/year) per capita | 0.31 tn |
| 2013 CO2 emissions intensity (tonnes/km²/year) | 486.9 tons/km² |
Natural Hazards Risk
Relative risk out of 10| Flood | High (8) |
| Earthquake | Low (2) |
* Risk, particularly concerning flood or landslide, may not be for the entire area.
Sources: 1. Dilley, M., R.S. Chen, U. Deichmann, A.L. Lerner-Lam, M. Arnold, J. Agwe, P. Buys, O. Kjekstad, B. Lyon, and G. Yetman. 2005. Natural Disaster Hotspots: A Global Risk Analysis. Washington, D.C.: World Bank. https://doi.org/10.1596/0-8213-5930-4.
2. Center for Hazards and Risk Research - CHRR - Columbia University, Center for International Earth Science Information Network - CIESIN - Columbia University. 2005. Global Flood Hazard Frequency and Distribution. Palisades, NY: NASA Socioeconomic Data and Applications Center (SEDAC). https://doi.org/10.7927/H4668B3D.
3. Center for Hazards and Risk Research - CHRR - Columbia University, Center for International Earth Science Information Network - CIESIN - Columbia University. 2005. Global Earthquake Hazard Distribution - Peak Ground Acceleration. Palisades, NY: NASA Socioeconomic Data and Applications Center (SEDAC). https://doi.org/10.7927/H4BZ63ZS.
Recent Nearby Earthquakes
Magnitude 3.0 and greaterWobulenzi, Central Region
Wobulenzi is a town in Luweero District in the Central Region of Uganda. Wobulenzi Wikipedia Page

About Our Data
The data on this page is estimated using a number of publicly available tools and resources. It is provided without warranty, and could contain inaccuracies. Use at your own risk. See here for more information.