- World
- »
- US
- »
- Illinois
- »
- Batavia, Illinois
Businesses in Batavia, Illinois
Hotels & Travel
Restaurants
Automotive
Financial Services
Medical
Beauty & Spas
Community & Government
Industries
Business Distribution by Industry Shopping: 16.7%
Professional Services: 16.7%
Industry: 12.4%
Home Services: 9.9%
Medical: 8.7%
Restaurants: 5.4%
Financial Services: 5.2%
Other: 25.1%
| Industry Description | Number of Establishments | Average Age of Business | Average Google Rating | Businesses per 1,000 residents |
|---|---|---|---|---|
| Car repair | 78 | 30.6 years | 4.1 | 2.7 |
| Beauty salons | 27 | 25.9 years | 4.3 | 0.9 |
| Hairdressers | 31 | 29.5 years | 4.4 | 1.1 |
| Public administration | 28 | 54.1 years | 4.8 | 1.0 |
| Social work | 36 | 27.7 years | 4.2 | 1.2 |
| Atm's | 29 | 64.5 years | 3.8 | 1.0 |
| Banks | 27 | 76 years | 3.8 | 0.9 |
| Finance other | 28 | 73.5 years | 3.8 | 1.0 |
| Loan companies | 55 | 34.7 years | 4.6 | 1.9 |
| Electrical installation | 27 | 29.1 years | 4.8 | 0.9 |
| General contractors | 130 | 31 years | 4.3 | 4.5 |
| Landscaping | 28 | 25.4 years | 4.3 | 1.0 |
| Other construction | 78 | 31 years | 4.5 | 2.7 |
| Real estate | 57 | 40.3 years | 3.7 | 2.0 |
| Construction of buildings | 99 | 31.7 years | 4.5 | 3.4 |
| Wholesale of construction supplies | 24 | 34.2 years | 4.3 | 0.8 |
| Wholesale of machinery | 49 | 33.6 years | 3.4 | 1.7 |
| Dentists | 25 | 29.1 years | 4.9 | 0.9 |
| Health and medical | 180 | 31.3 years | 4.5 | 6.2 |
| Physicians and surgeons | 36 | 28.9 years | 3.5 | 1.2 |
| Advertising and marketing | 43 | 26 years | 4.4 | 1.5 |
| Corporate management | 78 | 25.5 years | 4.6 | 2.7 |
| Lawyers legal | 58 | 29.6 years | 4.5 | 2.0 |
| Scientific and technical services | 71 | 26.6 years | 3.8 | 2.4 |
| Specialized design | 45 | 24.8 years | 4.8 | 1.5 |
| Technical construction services | 24 | 34.7 years | 4.7 | 0.8 |
| Churches | 24 | 69 years | 4.7 | 0.8 |
| American restaurants | 27 | 31.1 years | 4.2 | 0.9 |
| Electronics stores | 41 | 32 years | 4.0 | 1.4 |
| Furniture stores | 24 | 30.7 years | 4.1 | 0.8 |
| Hardware stores | 35 | 32.3 years | 4.1 | 1.2 |
| Household appliances and goods | 36 | 39.2 years | 4.3 | 1.2 |
| Office supplies and stationery stores | 37 | 31.5 years | 4.0 | 1.3 |
| Pharmacies and drug stores | 27 | 49.1 years | 4.0 | 0.9 |
| Shopping other | 57 | 40.3 years | 4.2 | 2.0 |
| Public parks | 26 | 36.3 years | 4.6 | 0.9 |
| Area of Batavia, Illinois | 9.69 sq mi |
| Population | 29,129 |
| Male Population | 14,092 (48.4%) |
| Female Population | 15,037 (51.6%) |
| Population change from 1975 to 2015 | +23.5% |
| Population change from 2000 to 2015 | +41.8% |
| Median Age | 40.5 |
| Male Median Age | 39.1 |
| Female Median Age | 41.9 |
| Area Codes | 630, 708, 847 |
| Neighborhoods | Batavia, Historic District, Randall Road Corridor |
| Local Time | Wednesday 10:33 PM |
| Timezone | Central Daylight Time |
| Lat & Lng | 41.85003° / -88.31257° |
| Zip Codes | 60510 |
Batavia, Illinois - Map
Batavia, Illinois Population
Years 1975 to 2015| Data | 1975 | 1990 | 2000 | 2015 |
|---|---|---|---|---|
| Population | 23,593 | 22,531 | 20,541 | 29,129 |
| Population Density | 2,435 / mi² | 2,325 / mi² | 2,120 / mi² | 3,007 / mi² |
Batavia, Illinois Population change from 2000 to 2015
Increase of 41.8% from year 2000 to 2015| Location | Change since 1975 | Change since 1990 | Change since 2000 |
|---|---|---|---|
| Batavia, Illinois | +23.5% | +29.3% | +41.8% |
| Illinois | +16.7% | +9.7% | +3.9% |
| United States | +46.9% | +27.2% | +13.7% |
Batavia, Illinois Median Age
Median Age: 40.5 years| Location | Median Age | Median Age (Female) | Median Age (Male) |
|---|---|---|---|
| Batavia, Illinois | 40.5 years | 41.9 years | 39.1 years |
| Illinois | 36.6 years | 37.9 years | 35.3 years |
| United States | 37.4 years | 38.7 years | 36.1 years |
Batavia, Illinois Population Tree
Population By Age and Gender| Age | Male | Female | Total |
|---|---|---|---|
| Under 5 | 874 | 814 | 1,688 |
| 5-9 | 1,103 | 1,118 | 2,221 |
| 10-14 | 1,270 | 1,150 | 2,420 |
| 15-19 | 1,178 | 1,021 | 2,200 |
| 20-24 | 660 | 723 | 1,383 |
| 25-29 | 654 | 673 | 1,327 |
| 30-34 | 641 | 686 | 1,327 |
| 35-39 | 812 | 883 | 1,695 |
| 40-44 | 1,051 | 1,215 | 2,266 |
| 45-49 | 1,323 | 1,413 | 2,737 |
| 50-54 | 1,284 | 1,296 | 2,581 |
| 55-59 | 1,066 | 1,119 | 2,185 |
| 60-64 | 751 | 799 | 1,551 |
| 65-69 | 466 | 455 | 922 |
| 70-74 | 292 | 344 | 636 |
| 75-79 | 229 | 356 | 586 |
| 80-84 | 209 | 375 | 585 |
| 85 Plus | 229 | 597 | 826 |
Batavia, Illinois Population Density
Population Density: 3,007 / mi²| Location | Population | Area | Population Density |
|---|---|---|---|
| Batavia, Illinois | 29,129 | 9.69 sq mi | 3,007 / mi² |
| Illinois | 13.0 million | 57,913.8 sq mi | 224.0 / mi² |
| United States | 321.6 million | 3,796,761.2 sq mi | 84.7 / mi² |
Batavia, Illinois Projected Population
Estimated Population from 1975 to 2100Sources:
1. JRC (European Commission's Joint Research Centre) work on the GHS built-up grid
2. CIESIN (Center for International Earth Science Information Network)
3. [Link] Klein Goldewijk, K., Beusen, A., Doelman, J., and Stehfest, E.: Anthropogenic land use estimates for the Holocene – HYDE 3.2, Earth Syst. Sci. Data, 9, 927–953, https://doi.org/10.5194/essd-9-927-2017, 2017.
Neighborhoods
Business Distribution by neighborhood in Batavia, Illinois Historic District: 52.1%
Randall Road Corridor: 23.7%
Batavia: 15.4%
Other: 8.7%
Business distribution by price for Batavia, Illinois
Moderate: 50.4%
Inexpensive: 39.2%
Expensive: 5.4%
Very Expensive: 5%
Human Development Index (HDI)
Statistic composite index of life expectancy, education, and per capita income.Sources: [Link] Kummu, M., Taka, M. & Guillaume, J. Gridded global datasets for Gross Domestic Product and Human Development Index over 1990–2015. Sci Data 5, 180004 (2018) doi:10.1038/sdata.2018.4
Batavia, Illinois CO2 Emissions
Carbon Dioxide (CO2) Emissions Per Capita in Tonnes Per Year| Location | CO2 Emissions | CO2 Emissions Per Capita | CO2 Emissions Intensity |
|---|---|---|---|
| Batavia, Illinois | 581,936 tn | 20 tn | 60,074 tons/mi² |
| Illinois | 259,471,378 tn | 20 tn | 4,480 tons/mi² |
| United States | 5,664,619,809 tn | 17.6 tn | 1,491 tons/mi² |
Batavia, Illinois CO2 Emissions
| 2013 CO2 emissions (tonnes/year) | 581,936 tn |
| 2013 CO2 emissions (tonnes/year) per capita | 20 tn |
| 2013 CO2 emissions intensity (tonnes/mi²/year) |
Natural Hazards Risk
Relative risk out of 10| Flood | High (8) |
* Risk, particularly concerning flood or landslide, may not be for the entire area.
Sources: 1. Dilley, M., R.S. Chen, U. Deichmann, A.L. Lerner-Lam, M. Arnold, J. Agwe, P. Buys, O. Kjekstad, B. Lyon, and G. Yetman. 2005. Natural Disaster Hotspots: A Global Risk Analysis. Washington, D.C.: World Bank. https://doi.org/10.1596/0-8213-5930-4.
2. Center for Hazards and Risk Research - CHRR - Columbia University, Center for International Earth Science Information Network - CIESIN - Columbia University. 2005. Global Flood Hazard Frequency and Distribution. Palisades, NY: NASA Socioeconomic Data and Applications Center (SEDAC). https://doi.org/10.7927/H4668B3D.
Recent Nearby Earthquakes
Magnitude 3.0 and greater| Date | Time | Magnitude | Distance | Depth | Location | Link |
|---|---|---|---|---|---|---|
| 11/4/13 | 10:35 AM | 3.2 | 40.9 km | 1,000 m | 1km NW of Summit, Illinois | usgs.gov |
| 2/10/10 | 1:59 AM | 3.8 | 20.3 km | 10,000 m | 8km NW of Village of Campton Hills, Illinois | usgs.gov |
| 6/27/04 | 11:10 PM | 4.2 | 65.4 km | 10,000 m | 10km NW of Ottawa, Illinois | usgs.gov |
| 9/2/99 | 9:17 AM | 3.5 | 94.2 km | 5,000 m | Illinois | usgs.gov |
| 9/14/72 | 10:22 PM | 4.04 | 90.8 km | 11,000 m | Illinois | usgs.gov |
| 1/2/12 | 8:21 AM | 4.5 | 41.9 km | None | Illinois | usgs.gov |
| 5/26/09 | 6:42 AM | 5.1 | 32.9 km | None | Illinois | usgs.gov |
| 5/26/81 | 4:07 PM | 4.6 | 89.7 km | None | Illinois | usgs.gov |
| 8/20/04 | 12:17 PM | 4.4 | 45.7 km | None | Illinois | usgs.gov |

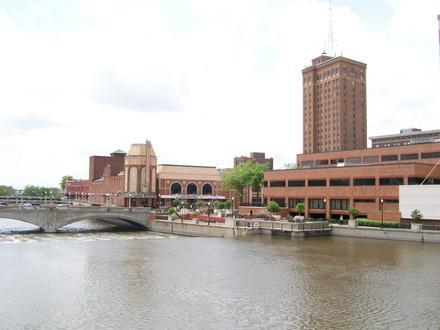
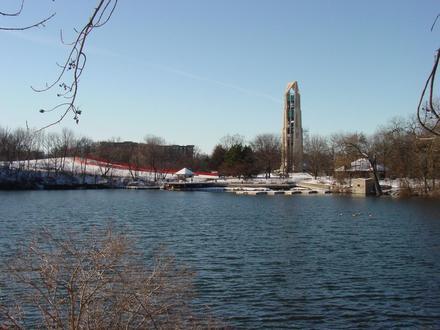
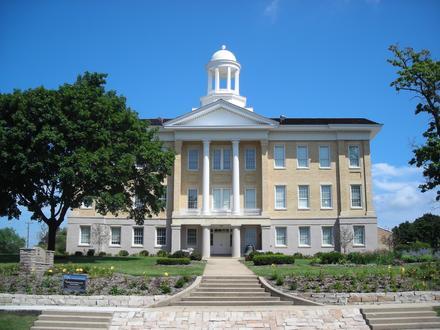
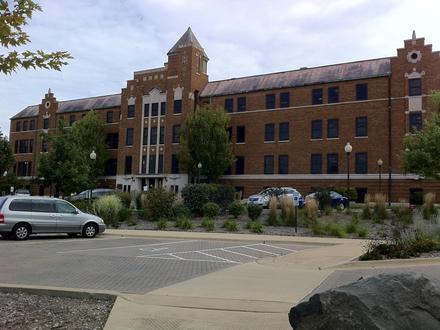
Batavia, Illinois
Batavia is a suburb of Chicago. It was founded in 1833, and is the oldest city in Kane County, Illinois. A small portion of Batavia lies in DuPage County. During the latter part of the 19th century, Batavia, home to six American-style windmill manufa.. Batavia, Illinois Wikipedia Page
About Our Data
The data on this page is estimated using a number of publicly available tools and resources. It is provided without warranty, and could contain inaccuracies. Use at your own risk. See here for more information.