Businesses in Bath, North Carolina
Hotels & Travel
Restaurants
Automotive
Financial Services
Medical
Beauty & Spas
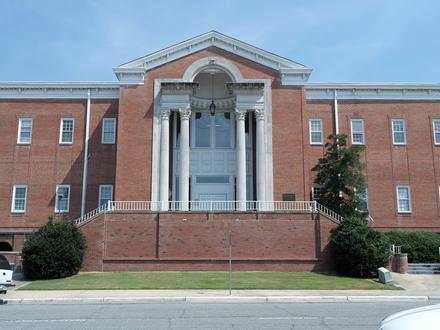
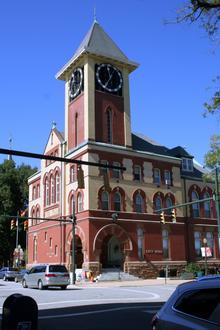
Community & Government
Industries
Business Distribution by Industry Industry: 15.5%
Home Services: 12.9%
Religion: 11.5%
Shopping: 10.4%
Professional Services: 10.1%
Food: 6.1%
Automotive: 6.1%
Sports & Activities: 5%
Other: 22.3%
| Industry Description | Number of Establishments | Average Age of Business | Average Google Rating | Businesses per 1,000 residents |
|---|---|---|---|---|
| Grocery stores and supermarkets | 7 | 34.2 years | 3.9 | 28.5 |
| General contractors | 10 | 40 years | 4.6 | 40.7 |
| Construction of buildings | 6 | 43.3 years | 3.0 | 24.4 |
| Churches | 16 | 102.8 years | 4.5 | 65.0 |
| Area of Bath, North Carolina | 0.927 sq mi |
| Population | 246 |
| Male Population | 117 (47.7%) |
| Female Population | 129 (52.3%) |
| Population change from 1975 to 2015 | +112.1% |
| Population change from 2000 to 2015 | +6% |
| Median Age | 63.8 |
| Male Median Age | 61.7 |
| Female Median Age | 65.8 |
| Area Codes | 252 |
| Local Time | Thursday 7:04 PM |
| Timezone | Eastern Daylight Time |
| Lat & Lng | 35.47711° / -76.8116° |
| Zip Codes | 27808 |
Bath, North Carolina - Map
Bath, North Carolina Population
Years 1975 to 2015| Data | 1975 | 1990 | 2000 | 2015 |
|---|---|---|---|---|
| Population | 116 | 168 | 232 | 246 |
| Population Density | 125.2 / mi² | 181.3 / mi² | 250.4 / mi² | 265.5 / mi² |
Bath, North Carolina Population change from 2000 to 2015
Increase of 6% from year 2000 to 2015| Location | Change since 1975 | Change since 1990 | Change since 2000 |
|---|---|---|---|
| Bath, North Carolina | +112.1% | +46.4% | +6% |
| North Carolina | +99.6% | +54.2% | +27.7% |
| United States | +46.9% | +27.2% | +13.7% |
Bath, North Carolina Median Age
Median Age: 63.8 years| Location | Median Age | Median Age (Female) | Median Age (Male) |
|---|---|---|---|
| Bath, North Carolina | 63.8 years | 65.8 years | 61.7 years |
| North Carolina | 37.5 years | 38.8 years | 36.1 years |
| United States | 37.4 years | 38.7 years | 36.1 years |
Bath, North Carolina Population Tree
Population By Age and Gender| Age | Male | Female | Total |
|---|---|---|---|
| Under 5 | 4 | 3 | 8 |
| 5-9 | 0 | 0 | 1 |
| 10-14 | 3 | 3 | 6 |
| 15-19 | 1 | 1 | 3 |
| 20-24 | 7 | 0 | 7 |
| 25-29 | 1 | 0 | 2 |
| 30-34 | 0 | 0 | 1 |
| 35-39 | 0 | 0 | 1 |
| 40-44 | 3 | 6 | 9 |
| 45-49 | 7 | 9 | 17 |
| 50-54 | 17 | 10 | 28 |
| 55-59 | 14 | 20 | 35 |
| 60-64 | 5 | 10 | 15 |
| 65-69 | 17 | 19 | 36 |
| 70-74 | 11 | 16 | 27 |
| 75-79 | 10 | 0 | 10 |
| 80-84 | 10 | 21 | 31 |
| 85 Plus | 9 | 12 | 21 |
Bath, North Carolina Population Density
Population Density: 265.5 / mi²| Location | Population | Area | Population Density |
|---|---|---|---|
| Bath, North Carolina | 246 | 0.927 sq mi | 265.5 / mi² |
| North Carolina | 10.3 million | 53,819.4 sq mi | 191.9 / mi² |
| United States | 321.6 million | 3,796,761.2 sq mi | 84.7 / mi² |
Bath, North Carolina Historical and Projected Population
Estimated Population from 1730 to 2100Sources:
1. JRC (European Commission's Joint Research Centre) work on the GHS built-up grid
2. CIESIN (Center for International Earth Science Information Network)
3. [Link] Klein Goldewijk, K., Beusen, A., Doelman, J., and Stehfest, E.: Anthropogenic land use estimates for the Holocene – HYDE 3.2, Earth Syst. Sci. Data, 9, 927–953, https://doi.org/10.5194/essd-9-927-2017, 2017.
Business distribution by price for Bath, North Carolina
Inexpensive: 57.1%
Moderate: 28.6%
Expensive: 14.3%
Human Development Index (HDI)
Statistic composite index of life expectancy, education, and per capita income.Sources: [Link] Kummu, M., Taka, M. & Guillaume, J. Gridded global datasets for Gross Domestic Product and Human Development Index over 1990–2015. Sci Data 5, 180004 (2018) doi:10.1038/sdata.2018.4
Bath, North Carolina CO2 Emissions
Carbon Dioxide (CO2) Emissions Per Capita in Tonnes Per Year| Location | CO2 Emissions | CO2 Emissions Per Capita | CO2 Emissions Intensity |
|---|---|---|---|
| Bath, North Carolina | 4,774 tn | 19.4 tn | 5,152 tons/mi² |
| North Carolina | 168,507,440 tn | 16.3 tn | 3,130 tons/mi² |
| United States | 5,664,619,809 tn | 17.6 tn | 1,491 tons/mi² |
Bath, North Carolina CO2 Emissions
| 2013 CO2 emissions (tonnes/year) | 4,774 tn |
| 2013 CO2 emissions (tonnes/year) per capita | 19.4 tn |
| 2013 CO2 emissions intensity (tonnes/mi²/year) |
Natural Hazards Risk
Relative risk out of 10| Cyclone | High (9) |
| Flood | Medium (4) |
* Risk, particularly concerning flood or landslide, may not be for the entire area.
Sources: 1. Dilley, M., R.S. Chen, U. Deichmann, A.L. Lerner-Lam, M. Arnold, J. Agwe, P. Buys, O. Kjekstad, B. Lyon, and G. Yetman. 2005. Natural Disaster Hotspots: A Global Risk Analysis. Washington, D.C.: World Bank. https://doi.org/10.1596/0-8213-5930-4.
2. Center for Hazards and Risk Research - CHRR - Columbia University, Center for International Earth Science Information Network - CIESIN - Columbia University. 2005. Global Flood Hazard Frequency and Distribution. Palisades, NY: NASA Socioeconomic Data and Applications Center (SEDAC). https://doi.org/10.7927/H4668B3D.
3. Center for Hazards and Risk Research - CHRR - Columbia University, Center for International Earth Science Information Network - CIESIN - Columbia University, International Bank for Reconstruction and Development - The World Bank, and United Nations Environment Programme Global Resource Information Database Geneva - UNEP/GRID-Geneva. 2005. Global Cyclone Hazard Frequency and Distribution. Palisades, NY: NASA Socioeconomic Data and Applications Center (SEDAC). https://doi.org/10.7927/H4CZ353K.
Recent Nearby Earthquakes
Magnitude 3.0 and greater| Date | Time | Magnitude | Distance | Depth | Location | Link |
|---|---|---|---|---|---|---|
| 8/6/94 | 12:54 PM | 3.8 | 45.8 km | 5,000 m | North Carolina | usgs.gov |
Bath, North Carolina
Bath is a town in Beaufort County, North Carolina, United States. The population was 249 at the 2010 census. Incorporated in 1705, Bath was North Carolina's first port of entry, located on the Pamlico River near its mouth. It developed a trade in nav.. Bath, North Carolina Wikipedia Page
About Our Data
The data on this page is estimated using a number of publicly available tools and resources. It is provided without warranty, and could contain inaccuracies. Use at your own risk. See here for more information.