- World
- »
- US
- »
- Colorado
- »
- Boulder, Colorado
Businesses in Boulder, Colorado
Hotels & Travel
Restaurants
Automotive
Financial Services
Medical
Beauty & Spas
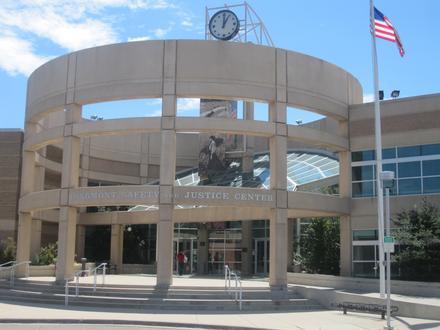
Community & Government
Industries
Business Distribution by Industry Professional Services: 20.4%
Medical: 16%
Shopping: 15.9%
Home Services: 7%
Industry: 6.6%
Other: 34.2%
| Industry Description | Number of Establishments | Average Age of Business | Average Google Rating | Businesses per 1,000 residents |
|---|---|---|---|---|
| Car repair | 239 | 35.6 years | 4.4 | 2.4 |
| Beauty salons | 225 | 23.4 years | 4.3 | 2.3 |
| Hairdressers | 200 | 24.1 years | 4.3 | 2.0 |
| Public administration | 242 | 35.5 years | 3.5 | 2.5 |
| Social work | 463 | 25.6 years | 4.6 | 4.7 |
| Education other | 203 | 27.9 years | 4.6 | 2.1 |
| Higher education (colleges and universities) | 199 | 31.4 years | 4.2 | 2.0 |
| Finance other | 232 | 43.4 years | 3.3 | 2.4 |
| Loan companies | 460 | 32 years | 4.4 | 4.7 |
| General contractors | 423 | 30 years | 4.3 | 4.3 |
| Other construction | 223 | 33.8 years | 4.4 | 2.3 |
| Real estate | 950 | 30.7 years | 4.1 | 9.7 |
| Construction of buildings | 305 | 31.4 years | 4.2 | 3.1 |
| Other membership organizations | 261 | 35.9 years | 4.4 | 2.7 |
| Wholesale of machinery | 206 | 27.5 years | 3.8 | 2.1 |
| Acupuncture | 200 | 23 years | 4.9 | 2.0 |
| Alternative medicine | 218 | 22.9 years | 4.5 | 2.2 |
| Chiropractors | 204 | 26.3 years | 4.9 | 2.1 |
| Dentists | 221 | 30.5 years | 4.6 | 2.2 |
| Health and medical | 2,799 | 27.4 years | 4.3 | 28.5 |
| Physicians and surgeons | 712 | 29.6 years | 4.0 | 7.2 |
| Physiotherapy | 221 | 25 years | 4.5 | 2.2 |
| Psychiatrists and psychotherapists | 533 | 25.9 years | 4.4 | 5.4 |
| Accountants | 268 | 28.9 years | 4.5 | 2.7 |
| Advertising and marketing | 390 | 24.1 years | 4.8 | 4.0 |
| Architects | 220 | 29.7 years | 4.8 | 2.2 |
| Computer programming, web design | 256 | 26 years | 4.5 | 2.6 |
| Corporate management | 937 | 26.1 years | 4.0 | 9.5 |
| Lawyers legal | 752 | 27.8 years | 4.6 | 7.6 |
| Research, development and testing services | 211 | 28.2 years | 4.0 | 2.1 |
| Scientific and technical services | 587 | 25.2 years | 4.3 | 6.0 |
| Specialized design | 397 | 24 years | 4.8 | 4.0 |
| Technical construction services | 353 | 29.6 years | 4.2 | 3.6 |
| Clothing stores | 225 | 27.2 years | 4.2 | 2.3 |
| Electronics stores | 602 | 26.8 years | 3.8 | 6.1 |
| Shopping other | 247 | 33.2 years | 4.1 | 2.5 |
| Area of Boulder, Colorado | 25.68 sq mi |
| Population | 98,345 |
| Male Population | 50,642 (51.5%) |
| Female Population | 47,703 (48.5%) |
| Population change from 1975 to 2015 | +108.4% |
| Population change from 2000 to 2015 | +12.4% |
| Median Age | 28.7 |
| Male Median Age | 27.9 |
| Female Median Age | 29.5 |
| Area Codes | 303, 720 |
| Neighborhoods | Baseline Sub, Central Boulder, East Boulder, Gunbarrel, North Boulder, South Boulder |
| Local Time | Wednesday 9:33 PM |
| Timezone | Mountain Daylight Time |
| Facebook Profile | |
| Lat & Lng | 40.01499° / -105.27055° |
| Zip Codes | 80301, 80302, 80303, 80304, 80305, More |
Boulder, Colorado - Map
Boulder, Colorado Population
Years 1975 to 2015| Data | 1975 | 1990 | 2000 | 2015 |
|---|---|---|---|---|
| Population | 47,189 | 69,908 | 87,507 | 98,345 |
| Population Density | 1,837 / mi² | 2,722 / mi² | 3,408 / mi² | 3,830 / mi² |
Boulder, Colorado Population change from 2000 to 2015
Increase of 12.4% from year 2000 to 2015| Location | Change since 1975 | Change since 1990 | Change since 2000 |
|---|---|---|---|
| Boulder, Colorado | +108.4% | +40.7% | +12.4% |
| Colorado | +89.1% | +49.1% | +25.1% |
| United States | +46.9% | +27.2% | +13.7% |
Boulder, Colorado Median Age
Median Age: 28.7 years| Location | Median Age | Median Age (Female) | Median Age (Male) |
|---|---|---|---|
| Boulder, Colorado | 28.7 years | 29.5 years | 27.9 years |
| Colorado | 36.1 years | 37.1 years | 35.2 years |
| United States | 37.4 years | 38.7 years | 36.1 years |
Boulder, Colorado Population Tree
Population By Age and Gender| Age | Male | Female | Total |
|---|---|---|---|
| Under 5 | 1,983 | 1,943 | 3,927 |
| 5-9 | 1,928 | 1,865 | 3,794 |
| 10-14 | 1,759 | 1,700 | 3,460 |
| 15-19 | 5,401 | 5,504 | 10,906 |
| 20-24 | 11,307 | 9,137 | 20,445 |
| 25-29 | 5,125 | 4,145 | 9,271 |
| 30-34 | 3,685 | 3,171 | 6,857 |
| 35-39 | 3,117 | 2,777 | 5,895 |
| 40-44 | 2,856 | 2,630 | 5,487 |
| 45-49 | 2,579 | 2,575 | 5,154 |
| 50-54 | 2,625 | 2,610 | 5,236 |
| 55-59 | 2,470 | 2,541 | 5,011 |
| 60-64 | 2,107 | 2,037 | 4,144 |
| 65-69 | 1,256 | 1,369 | 2,626 |
| 70-74 | 836 | 1,023 | 1,859 |
| 75-79 | 609 | 808 | 1,418 |
| 80-84 | 496 | 790 | 1,287 |
| 85 Plus | 503 | 1,076 | 1,579 |
Boulder, Colorado Population Density
Population Density: 3,830 / mi²| Location | Population | Area | Population Density |
|---|---|---|---|
| Boulder, Colorado | 98,345 | 25.68 sq mi | 3,830 / mi² |
| Colorado | 5.4 million | 104,094.5 sq mi | 52.0 / mi² |
| United States | 321.6 million | 3,796,761.2 sq mi | 84.7 / mi² |
Boulder, Colorado Historical and Projected Population
Estimated Population from 1890 to 2100Sources:
1. JRC (European Commission's Joint Research Centre) work on the GHS built-up grid
2. CIESIN (Center for International Earth Science Information Network)
3. [Link] Klein Goldewijk, K., Beusen, A., Doelman, J., and Stehfest, E.: Anthropogenic land use estimates for the Holocene – HYDE 3.2, Earth Syst. Sci. Data, 9, 927–953, https://doi.org/10.5194/essd-9-927-2017, 2017.
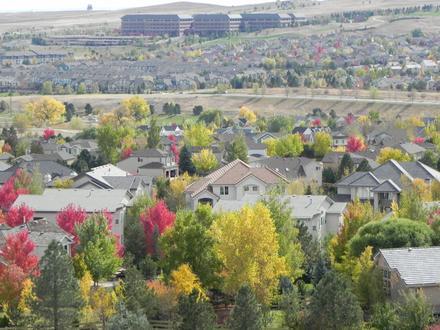
Neighborhoods
Business Distribution by neighborhood in Boulder, Colorado Central Boulder: 48.2%
North Boulder: 11.4%
East Boulder: 8.5%
Gunbarrel: 7.4%
Other: 24.5%
Area Codes
Percentage Area Codes used by businesses in Boulder, Colorado Area Code 303: 81.9%
Area Code 720: 14.8%
Other: 3.4%
Business distribution by price for Boulder, Colorado
Moderate: 53.4%
Inexpensive: 27.8%
Expensive: 14%
Very Expensive: 4.8%
Human Development Index (HDI)
Statistic composite index of life expectancy, education, and per capita income.Sources: [Link] Kummu, M., Taka, M. & Guillaume, J. Gridded global datasets for Gross Domestic Product and Human Development Index over 1990–2015. Sci Data 5, 180004 (2018) doi:10.1038/sdata.2018.4
Boulder, Colorado CO2 Emissions
Carbon Dioxide (CO2) Emissions Per Capita in Tonnes Per Year| Location | CO2 Emissions | CO2 Emissions Per Capita | CO2 Emissions Intensity |
|---|---|---|---|
| Boulder, Colorado | 1,799,093 tn | 18.3 tn | 70,069 tons/mi² |
| Colorado | 108,781,948 tn | 20.1 tn | 1,045 tons/mi² |
| United States | 5,664,619,809 tn | 17.6 tn | 1,491 tons/mi² |
Boulder, Colorado CO2 Emissions
| 2013 CO2 emissions (tonnes/year) | 1,799,093 tn |
| 2013 CO2 emissions (tonnes/year) per capita | 18.3 tn |
| 2013 CO2 emissions intensity (tonnes/mi²/year) |
Natural Hazards Risk
Relative risk out of 10| Drought | Medium (4.5) |
* Risk, particularly concerning flood or landslide, may not be for the entire area.
Sources: 1. Dilley, M., R.S. Chen, U. Deichmann, A.L. Lerner-Lam, M. Arnold, J. Agwe, P. Buys, O. Kjekstad, B. Lyon, and G. Yetman. 2005. Natural Disaster Hotspots: A Global Risk Analysis. Washington, D.C.: World Bank. https://doi.org/10.1596/0-8213-5930-4.
2. Center for Hazards and Risk Research - CHRR - Columbia University, Center for International Earth Science Information Network - CIESIN - Columbia University, and International Research Institute for Climate and Society - IRI - Columbia University. 2005. Global Drought Hazard Frequency and Distribution. Palisades, NY: NASA Socioeconomic Data and Applications Center (SEDAC). https://doi.org/10.7927/H4VX0DFT.
Recent Nearby Earthquakes
Magnitude 3.0 and greater| Date | Time | Magnitude | Distance | Depth | Location | Link |
|---|---|---|---|---|---|---|
| 5/31/14 | 8:35 PM | 3.2 | 75.5 km | 1,200 m | 9km ENE of Greeley, Colorado | usgs.gov |
| 12/25/94 | 11:06 AM | 4 | 89.6 km | 10,000 m | Colorado | usgs.gov |
| 4/2/81 | 8:10 AM | 4.3 | 28.7 km | 8,000 m | Denver urban area, Colorado | usgs.gov |
| 11/26/67 | 9:09 PM | 5.2 | 37.1 km | 5,000 m | Denver urban area, Colorado | usgs.gov |
| 8/9/67 | 6:25 AM | 5.3 | 50.4 km | 5,000 m | Colorado | usgs.gov |
| 4/27/67 | 9:24 AM | 4.5 | 44.3 km | 5,000 m | Colorado | usgs.gov |
| 4/10/67 | 11:00 AM | 4.3 | 45.2 km | 5,000 m | Colorado | usgs.gov |
| 11/14/66 | 12:02 PM | 3.5 | 50.4 km | 5,000 m | Colorado | usgs.gov |
| 11/20/65 | 8:02 PM | 3.8 | 46.8 km | 5,000 m | Denver urban area, Colorado | usgs.gov |
| 9/29/65 | 11:59 AM | 3.5 | 28 km | 5,000 m | Denver urban area, Colorado | usgs.gov |
Find historical earthquake occurrences near Boulder, Colorado
Earliest Date Latest Date
Magnitude 3.0 and greater Magnitude 4.0 and greater Magnitude 5.0 and greater

Boulder, Colorado
Boulder is the home rule municipality that is the county seat and the most populous municipality of Boulder County, and the 11th most populous municipality in the U.S. state of Colorado. Boulder is located at the base of the foothills of the Rocky Mo.. Boulder, Colorado Wikipedia Page
Zip Codes
Percentage of businesses by Zip Codes in Boulder, Colorado Zip Code 80301: 31.4%
Zip Code 80302: 28.3%
Zip Code 80304: 15.4%
Zip Code 80303: 14.7%
Zip Code 80305: 6.7%
Other: 3.5%
About Our Data
The data on this page is estimated using a number of publicly available tools and resources. It is provided without warranty, and could contain inaccuracies. Use at your own risk. See here for more information.