Businesses in Brewster, Washington
Hotels & Travel
Restaurants
Automotive
Financial Services
Medical
Beauty & Spas
Community & Government
Industries
Business Distribution by Industry Medical: 20.2%
Shopping: 14.2%
Industry: 10.4%
Food: 7.3%
Automotive: 6.6%
Home Services: 6.5%
Professional Services: 5.4%
Other: 29.3%
| Industry Description | Number of Establishments | Average Age of Business | Average Google Rating | Businesses per 1,000 residents |
|---|---|---|---|---|
| Car parts | 5 | 3.8 | 2.2 | |
| Car repair | 8 | 46.2 years | 4.1 | 3.6 |
| Gas stations | 13 | 31.9 years | 3.8 | 5.8 |
| Beauty salons | 5 | 4.6 | 2.2 | |
| Social work | 6 | 29.9 years | 4.5 | 2.7 |
| Atm's | 8 | 5.0 | 3.6 | |
| Banks | 8 | 5.0 | 3.6 | |
| Loan companies | 6 | 53.7 years | 4.8 | 2.7 |
| Convenience stores | 7 | 3.8 | 3.1 | |
| Fruits and vegetables | 17 | 43.8 years | 4.1 | 7.6 |
| Grocery stores and supermarkets | 19 | 38 years | 4.1 | 8.4 |
| General contractors | 8 | 34.2 years | 5.0 | 3.6 |
| Real estate | 5 | 36.3 years | 2.2 | |
| Dentists | 10 | 30.5 years | 3.8 | 4.4 |
| General practitioners | 6 | 2.7 | ||
| Health and medical | 46 | 30.8 years | 4.0 | 20.4 |
| Medical clinics | 6 | 3.8 | 2.7 | |
| Physicians and surgeons | 16 | 3.3 | 7.1 | |
| Churches | 9 | 48.7 years | 4.3 | 4.0 |
| Hardware stores | 5 | 3.7 | 2.2 | |
| Shopping other | 6 | 41.7 years | 4.1 | 2.7 |
| Public parks | 5 | 4.0 | 2.2 |
| Area of Brewster, Washington | 1.189 sq mi |
| Population | 2,250 |
| Male Population | 1,131 (50.3%) |
| Female Population | 1,119 (49.7%) |
| Population change from 1975 to 2015 | +76.9% |
| Population change from 2000 to 2015 | +4.3% |
| Median Age | 27.7 |
| Male Median Age | 26.1 |
| Female Median Age | 29.4 |
| Area Codes | 509 |
| Local Time | Friday 8:16 AM |
| Timezone | Pacific Daylight Time |
| Lat & Lng | 48.09598° / -119.78062° |
| Zip Codes | 98812 |
Brewster, Washington - Map
Brewster, Washington Population
Years 1975 to 2015| Data | 1975 | 1990 | 2000 | 2015 |
|---|---|---|---|---|
| Population | 1,272 | 1,791 | 2,157 | 2,250 |
| Population Density | 1,069 / mi² | 1,506 / mi² | 1,813 / mi² | 1,892 / mi² |
Brewster, Washington Population change from 2000 to 2015
Increase of 4.3% from year 2000 to 2015| Location | Change since 1975 | Change since 1990 | Change since 2000 |
|---|---|---|---|
| Brewster, Washington | +76.9% | +25.6% | +4.3% |
| Washington | +78.3% | +41.1% | +20.1% |
| United States | +46.9% | +27.2% | +13.7% |
Brewster, Washington Median Age
Median Age: 27.7 years| Location | Median Age | Median Age (Female) | Median Age (Male) |
|---|---|---|---|
| Brewster, Washington | 27.7 years | 29.4 years | 26.1 years |
| Washington | 37.9 years | 38.9 years | 36.9 years |
| United States | 37.4 years | 38.7 years | 36.1 years |
Brewster, Washington Population Tree
Population By Age and Gender| Age | Male | Female | Total |
|---|---|---|---|
| Under 5 | 147 | 126 | 274 |
| 5-9 | 109 | 93 | 202 |
| 10-14 | 97 | 90 | 188 |
| 15-19 | 104 | 101 | 206 |
| 20-24 | 90 | 77 | 168 |
| 25-29 | 82 | 82 | 164 |
| 30-34 | 88 | 75 | 164 |
| 35-39 | 56 | 69 | 126 |
| 40-44 | 71 | 71 | 142 |
| 45-49 | 56 | 72 | 129 |
| 50-54 | 57 | 53 | 111 |
| 55-59 | 41 | 46 | 88 |
| 60-64 | 41 | 33 | 74 |
| 65-69 | 31 | 18 | 50 |
| 70-74 | 23 | 26 | 50 |
| 75-79 | 18 | 24 | 42 |
| 80-84 | 6 | 24 | 30 |
| 85 Plus | 14 | 38 | 52 |
Brewster, Washington Population Density
Population Density: 1,892 / mi²| Location | Population | Area | Population Density |
|---|---|---|---|
| Brewster, Washington | 2,250 | 1.189 sq mi | 1,892 / mi² |
| Washington | 7.1 million | 71,298.4 sq mi | 99.7 / mi² |
| United States | 321.6 million | 3,796,761.2 sq mi | 84.7 / mi² |
Brewster, Washington Historical and Projected Population
Estimated Population from 1880 to 2100Sources:
1. JRC (European Commission's Joint Research Centre) work on the GHS built-up grid
2. CIESIN (Center for International Earth Science Information Network)
3. [Link] Klein Goldewijk, K., Beusen, A., Doelman, J., and Stehfest, E.: Anthropogenic land use estimates for the Holocene – HYDE 3.2, Earth Syst. Sci. Data, 9, 927–953, https://doi.org/10.5194/essd-9-927-2017, 2017.
Human Development Index (HDI)
Statistic composite index of life expectancy, education, and per capita income.Sources: [Link] Kummu, M., Taka, M. & Guillaume, J. Gridded global datasets for Gross Domestic Product and Human Development Index over 1990–2015. Sci Data 5, 180004 (2018) doi:10.1038/sdata.2018.4
Brewster, Washington CO2 Emissions
Carbon Dioxide (CO2) Emissions Per Capita in Tonnes Per Year| Location | CO2 Emissions | CO2 Emissions Per Capita | CO2 Emissions Intensity |
|---|---|---|---|
| Brewster, Washington | 30,079 tn | 13.4 tn | 25,293 tons/mi² |
| Washington | 122,068,940 tn | 17.2 tn | 1,712 tons/mi² |
| United States | 5,664,619,809 tn | 17.6 tn | 1,491 tons/mi² |
Brewster, Washington CO2 Emissions
| 2013 CO2 emissions (tonnes/year) | 30,079 tn |
| 2013 CO2 emissions (tonnes/year) per capita | 13.4 tn |
| 2013 CO2 emissions intensity (tonnes/mi²/year) |
Natural Hazards Risk
Relative risk out of 10| Earthquake | Medium (4) |
* Risk, particularly concerning flood or landslide, may not be for the entire area.
Sources: 1. Dilley, M., R.S. Chen, U. Deichmann, A.L. Lerner-Lam, M. Arnold, J. Agwe, P. Buys, O. Kjekstad, B. Lyon, and G. Yetman. 2005. Natural Disaster Hotspots: A Global Risk Analysis. Washington, D.C.: World Bank. https://doi.org/10.1596/0-8213-5930-4.
2. Center for Hazards and Risk Research - CHRR - Columbia University, Center for International Earth Science Information Network - CIESIN - Columbia University. 2005. Global Earthquake Hazard Distribution - Peak Ground Acceleration. Palisades, NY: NASA Socioeconomic Data and Applications Center (SEDAC). https://doi.org/10.7927/H4BZ63ZS.
Recent Nearby Earthquakes
Magnitude 3.0 and greater| Date | Time | Magnitude | Distance | Depth | Location | Link |
|---|---|---|---|---|---|---|
| 7/24/17 | 12:53 PM | 3.33 | 47.2 km | 2,130 m | 7km NNE of Waterville, Washington | usgs.gov |
| 9/1/15 | 9:42 AM | 4.15 | 61.3 km | 9,130 m | 38km N of Coulee Dam, Washington | usgs.gov |
| 12/30/13 | 6:59 AM | 3.2 | 56.6 km | 6,372 m | 29km WSW of Tonasket, Washington | usgs.gov |
| 9/13/12 | 10:33 AM | 3.37 | 85.7 km | 9,292 m | Washington | usgs.gov |
| 8/7/12 | 4:59 PM | 3.22 | 59.6 km | 7,665 m | Washington | usgs.gov |
| 11/18/11 | 5:09 AM | 4.6 | 43.5 km | 11,168 m | Washington | usgs.gov |
| 3/25/10 | 3:31 PM | 3.2 | 90.6 km | 8,675 m | Washington | usgs.gov |
| 7/24/06 | 11:13 PM | 3.1 | 60.2 km | 5,387 m | Washington | usgs.gov |
| 1/14/04 | 4:13 AM | 3.3 | 38.7 km | 1,207 m | Washington | usgs.gov |
| 12/26/03 | 2:07 AM | 3.4 | 73.8 km | -600 m | Washington | usgs.gov |
Find historical earthquake occurrences near Brewster, Washington
Earliest Date Latest Date
Magnitude 3.0 and greater Magnitude 4.0 and greater Magnitude 5.0 and greater

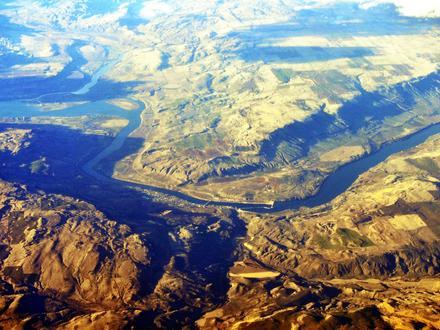
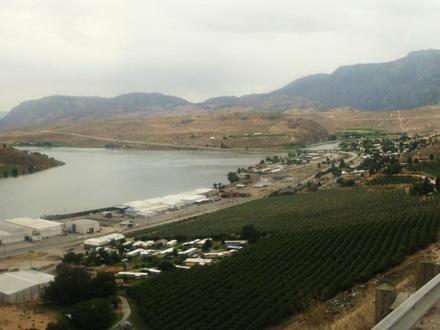
Brewster, Washington
Brewster is a city in Okanogan County, Washington, United States. The population was 2,370 at the 2010 census. Brewster, Washington Wikipedia Page
About Our Data
The data on this page is estimated using a number of publicly available tools and resources. It is provided without warranty, and could contain inaccuracies. Use at your own risk. See here for more information.