- World
- »
- US
- »
- California
- »
- Caspar, California
Businesses in Caspar, California
Industries
Business Distribution by Industry Shopping: 14%
Hotels & Travel: 14%
Restaurants: 12.3%
Professional Services: 12.3%
Medical: 8.8%
Local Services: 7%
Sports & Activities: 7%
Industry: 5.3%
Home Services: 5.3%
Beauty & Spas: 3.5%
Entertainment: 3.5%
Community & Government: 3.5%
Other: 3.5%
| Area of Caspar, California | 2.992 sq mi |
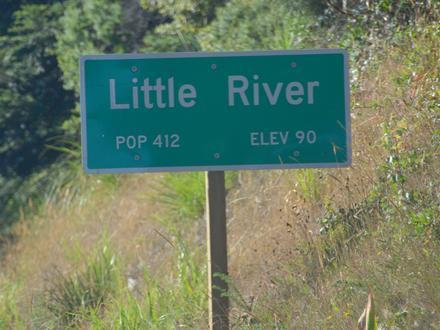
| Population | 505 |
| Male Population | 239 (47.4%) |
| Female Population | 266 (52.6%) |
| Population change from 1975 to 2015 | +45.1% |
| Population change from 2000 to 2015 | +1.2% |
| Median Age | 56.6 |
| Male Median Age | 56.5 |
| Female Median Age | 56.7 |
| Area Codes | 707 |
| Local Time | Monday 12:50 PM |
| Timezone | Pacific Daylight Time |
| Lat & Lng | 39.3635° / -123.81585° |
| Zip Codes | 95420 |
Caspar, California - Map
Caspar, California Population
Years 1975 to 2015| Data | 1975 | 1990 | 2000 | 2015 |
|---|---|---|---|---|
| Population | 348 | 415 | 499 | 505 |
| Population Density | 116.3 / mi² | 138.7 / mi² | 166.8 / mi² | 168.8 / mi² |
Caspar, California Population change from 2000 to 2015
Increase of 1.2% from year 2000 to 2015| Location | Change since 1975 | Change since 1990 | Change since 2000 |
|---|---|---|---|
| Caspar, California | +45.1% | +21.7% | +1.2% |
| California | +51.8% | +28.5% | +13.9% |
| United States | +46.9% | +27.2% | +13.7% |
Caspar, California Median Age
Median Age: 56.6 years| Location | Median Age | Median Age (Female) | Median Age (Male) |
|---|---|---|---|
| Caspar, California | 56.6 years | 56.7 years | 56.5 years |
| California | 35.4 years | 36.5 years | 34.2 years |
| United States | 37.4 years | 38.7 years | 36.1 years |
Caspar, California Population Tree
Population By Age and Gender| Age | Male | Female | Total |
|---|---|---|---|
| Under 5 | 8 | 3 | 11 |
| 5-9 | 3 | 9 | 13 |
| 10-14 | 7 | 12 | 20 |
| 15-19 | 9 | 5 | 14 |
| 20-24 | 6 | 6 | 12 |
| 25-29 | 13 | 11 | 25 |
| 30-34 | 16 | 8 | 25 |
| 35-39 | 10 | 16 | 27 |
| 40-44 | 4 | 15 | 20 |
| 45-49 | 14 | 16 | 30 |
| 50-54 | 21 | 21 | 43 |
| 55-59 | 25 | 34 | 60 |
| 60-64 | 29 | 35 | 65 |
| 65-69 | 24 | 30 | 55 |
| 70-74 | 25 | 22 | 47 |
| 75-79 | 13 | 11 | 25 |
| 80-84 | 5 | 7 | 13 |
| 85 Plus | 5 | 5 | 11 |
Caspar, California Population Density
Population Density: 168.8 / mi²| Location | Population | Area | Population Density |
|---|---|---|---|
| Caspar, California | 505 | 2.992 sq mi | 168.8 / mi² |
| California | 38.8 million | 163,695.4 sq mi | 236.9 / mi² |
| United States | 321.6 million | 3,796,761.2 sq mi | 84.7 / mi² |
Caspar, California Historical and Projected Population
Estimated Population from 1860 to 2100Sources:
1. JRC (European Commission's Joint Research Centre) work on the GHS built-up grid
2. CIESIN (Center for International Earth Science Information Network)
3. [Link] Klein Goldewijk, K., Beusen, A., Doelman, J., and Stehfest, E.: Anthropogenic land use estimates for the Holocene – HYDE 3.2, Earth Syst. Sci. Data, 9, 927–953, https://doi.org/10.5194/essd-9-927-2017, 2017.
Human Development Index (HDI)
Statistic composite index of life expectancy, education, and per capita income.Sources: [Link] Kummu, M., Taka, M. & Guillaume, J. Gridded global datasets for Gross Domestic Product and Human Development Index over 1990–2015. Sci Data 5, 180004 (2018) doi:10.1038/sdata.2018.4
Caspar, California CO2 Emissions
Carbon Dioxide (CO2) Emissions Per Capita in Tonnes Per Year| Location | CO2 Emissions | CO2 Emissions Per Capita | CO2 Emissions Intensity |
|---|---|---|---|
| Caspar, California | 6,848 tn | 13.6 tn | 2,289 tons/mi² |
| California | 625,399,867 tn | 16.1 tn | 3,820 tons/mi² |
| United States | 5,664,619,809 tn | 17.6 tn | 1,491 tons/mi² |
Caspar, California CO2 Emissions
| 2013 CO2 emissions (tonnes/year) | 6,848 tn |
| 2013 CO2 emissions (tonnes/year) per capita | 13.6 tn |
| 2013 CO2 emissions intensity (tonnes/mi²/year) |
Natural Hazards Risk
Relative risk out of 10| Landslide | Medium (6) |
| Drought | High (9) |
| Flood | High (7) |
| Earthquake | High (10) |
* Risk, particularly concerning flood or landslide, may not be for the entire area.
Sources: 1. Dilley, M., R.S. Chen, U. Deichmann, A.L. Lerner-Lam, M. Arnold, J. Agwe, P. Buys, O. Kjekstad, B. Lyon, and G. Yetman. 2005. Natural Disaster Hotspots: A Global Risk Analysis. Washington, D.C.: World Bank. https://doi.org/10.1596/0-8213-5930-4.
2. Center for Hazards and Risk Research - CHRR - Columbia University, Center for International Earth Science Information Network - CIESIN - Columbia University, and Norwegian Geotechnical Institute - NGI. 2005. Global Landslide Hazard Distribution. Palisades, NY: NASA Socioeconomic Data and Applications Center (SEDAC). https://doi.org/10.7927/H4P848VZ.
3. Center for Hazards and Risk Research - CHRR - Columbia University, Center for International Earth Science Information Network - CIESIN - Columbia University, and International Research Institute for Climate and Society - IRI - Columbia University. 2005. Global Drought Hazard Frequency and Distribution. Palisades, NY: NASA Socioeconomic Data and Applications Center (SEDAC). https://doi.org/10.7927/H4VX0DFT.
4. Center for Hazards and Risk Research - CHRR - Columbia University, Center for International Earth Science Information Network - CIESIN - Columbia University. 2005. Global Earthquake Hazard Distribution - Peak Ground Acceleration. Palisades, NY: NASA Socioeconomic Data and Applications Center (SEDAC). https://doi.org/10.7927/H4BZ63ZS.
5. Center for Hazards and Risk Research - CHRR - Columbia University, Center for International Earth Science Information Network - CIESIN - Columbia University. 2005. Global Flood Hazard Frequency and Distribution. Palisades, NY: NASA Socioeconomic Data and Applications Center (SEDAC). https://doi.org/10.7927/H4668B3D.
Recent Nearby Earthquakes
Magnitude 3.0 and greater| Date | Time | Magnitude | Distance | Depth | Location | Link |
|---|---|---|---|---|---|---|
| 12/13/17 | 8:57 PM | 4.26 | 30.8 km | 7,040 m | 17km WSW of Laytonville, CA | usgs.gov |
| 11/6/16 | 5:00 AM | 4.06 | 36.3 km | -650 m | 13km WSW of Laytonville, California | usgs.gov |
| 11/3/16 | 5:57 AM | 3.82 | 36.8 km | -570 m | 13km WSW of Laytonville, California | usgs.gov |
| 12/3/15 | 3:02 AM | 3.04 | 24 km | 6,050 m | 17km ENE of Fort Bragg, California | usgs.gov |
| 8/29/15 | 1:13 AM | 3.04 | 23.4 km | 5,386 m | 17km WNW of Brooktrails, California | usgs.gov |
| 8/29/15 | 1:13 AM | 3.56 | 22.9 km | 5,046 m | 18km ENE of Fort Bragg, California | usgs.gov |
| 7/27/15 | 11:24 AM | 3.45 | 53.1 km | 5,880 m | 6km E of Point Arena, California | usgs.gov |
| 10/4/14 | 8:45 AM | 3.93 | 28.9 km | 3,403 m | 15km SW of Willits, California | usgs.gov |
| 2/15/13 | 1:18 PM | 3.36 | 41.7 km | 5,364 m | 5km WSW of Laytonville, California | usgs.gov |
| 1/26/13 | 5:10 AM | 3.45 | 53 km | 5,366 m | Northern California | usgs.gov |
Find historical earthquake occurrences near Caspar, California
Earliest Date Latest Date
Magnitude 3.0 and greater Magnitude 4.0 and greater Magnitude 5.0 and greater

Caspar, California
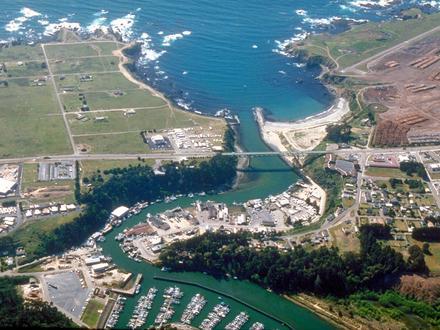
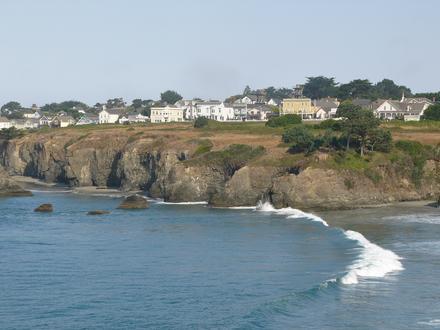
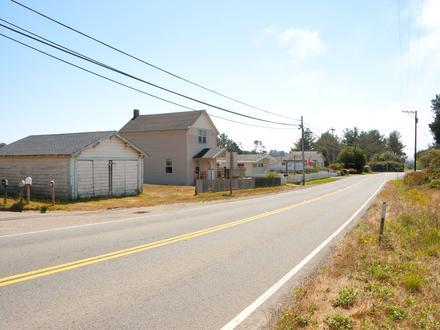
Caspar is a census-designated place in Mendocino County, California. It is located on the Pacific Ocean, 4 miles (6.4 km) north of Mendocino, at an elevation of 82 feet (25 m). It is bounded on three sides by state parks: the historic 1909 Point Cabr.. Caspar, California Wikipedia Page
About Our Data
The data on this page is estimated using a number of publicly available tools and resources. It is provided without warranty, and could contain inaccuracies. Use at your own risk. See here for more information.