Businesses in Castro Valley, California
Hotels & Travel
Restaurants
Automotive
Financial Services
Medical
Beauty & Spas
Community & Government
Industries
Business Distribution by Industry Medical: 20.3%
Shopping: 13.3%
Professional Services: 11.3%
Home Services: 10.9%
Industry: 5.8%
Local Services: 5.2%
Beauty & Spas: 5.1%
Other: 28%
| Industry Description | Number of Establishments | Average Age of Business | Average Google Rating | Businesses per 1,000 residents |
|---|---|---|---|---|
| Car repair | 64 | 37.7 years | 4.3 | 1.0 |
| Beauty salons | 94 | 24.8 years | 4.5 | 1.5 |
| Hairdressers | 87 | 27.4 years | 4.4 | 1.4 |
| Social work | 44 | 30.2 years | 4.6 | 0.7 |
| Finance other | 41 | 68.5 years | 3.8 | 0.7 |
| Loan companies | 65 | 32.6 years | 4.1 | 1.0 |
| Grocery stores and supermarkets | 30 | 35.1 years | 4.3 | 0.5 |
| Apartments | 41 | 28.3 years | 3.5 | 0.7 |
| Electrical installation | 30 | 33.2 years | 3.5 | 0.5 |
| General contractors | 115 | 33.7 years | 4.3 | 1.9 |
| Other construction | 69 | 35 years | 4.7 | 1.1 |
| Real estate | 200 | 31.8 years | 4.1 | 3.2 |
| Construction of buildings | 78 | 33.2 years | 3.9 | 1.3 |
| Child care and day care | 30 | 34.4 years | 3.9 | 0.5 |
| Chiropractors | 44 | 30.9 years | 4.9 | 0.7 |
| Dentists | 89 | 33.2 years | 4.8 | 1.4 |
| Health and medical | 656 | 31.2 years | 4.5 | 10.6 |
| Physicians and surgeons | 187 | 30.8 years | 4.0 | 3.0 |
| Physiotherapy | 36 | 31.6 years | 3.9 | 0.6 |
| Accountants | 43 | 30 years | 4.3 | 0.7 |
| Corporate management | 65 | 27.4 years | 4.7 | 1.0 |
| Lawyers legal | 42 | 33 years | 4.5 | 0.7 |
| Scientific and technical services | 85 | 26.5 years | 4.4 | 1.4 |
| Specialized design | 38 | 26.6 years | 4.9 | 0.6 |
| Churches | 40 | 53.1 years | 4.8 | 0.6 |
| Electronics stores | 47 | 29 years | 4.0 | 0.8 |
| Shopping other | 54 | 35.5 years | 4.4 | 0.9 |
| Area of Castro Valley, California | 16.92 sq mi |
| Population | 62,027 |
| Male Population | 30,161 (48.6%) |
| Female Population | 31,866 (51.4%) |
| Population change from 1975 to 2015 | +76.7% |
| Population change from 2000 to 2015 | +5.4% |
| Median Age | 40.6 |
| Male Median Age | 39.4 |
| Female Median Age | 41.7 |
| Area Codes | 510, 925 |
| Neighborhoods | Castro Valley, Central East, Downtown Castro Valley, East, South, Upper Castro Valley, West |
| Local Time | Saturday 8:22 PM |
| Timezone | Pacific Daylight Time |
| Lat & Lng | 37.6941° / -122.08635° |
| Zip Codes | 94546, 94552 |
Castro Valley, California - Map
Castro Valley, California Population
Years 1975 to 2015| Data | 1975 | 1990 | 2000 | 2015 |
|---|---|---|---|---|
| Population | 35,101 | 51,535 | 58,869 | 62,027 |
| Population Density | 2,074 / mi² | 3,046 / mi² | 3,479 / mi² | 3,666 / mi² |
Castro Valley, California Population change from 2000 to 2015
Increase of 5.4% from year 2000 to 2015| Location | Change since 1975 | Change since 1990 | Change since 2000 |
|---|---|---|---|
| Castro Valley, California | +76.7% | +20.4% | +5.4% |
| California | +51.8% | +28.5% | +13.9% |
| United States | +46.9% | +27.2% | +13.7% |
Castro Valley, California Median Age
Median Age: 40.6 years| Location | Median Age | Median Age (Female) | Median Age (Male) |
|---|---|---|---|
| Castro Valley, California | 40.6 years | 41.7 years | 39.4 years |
| California | 35.4 years | 36.5 years | 34.2 years |
| United States | 37.4 years | 38.7 years | 36.1 years |
Castro Valley, California Population Tree
Population By Age and Gender| Age | Male | Female | Total |
|---|---|---|---|
| Under 5 | 1,861 | 1,675 | 3,537 |
| 5-9 | 1,946 | 1,898 | 3,844 |
| 10-14 | 2,180 | 2,125 | 4,306 |
| 15-19 | 2,441 | 2,058 | 4,499 |
| 20-24 | 1,717 | 1,623 | 3,341 |
| 25-29 | 1,651 | 1,677 | 3,328 |
| 30-34 | 1,666 | 1,935 | 3,601 |
| 35-39 | 1,856 | 2,149 | 4,005 |
| 40-44 | 2,155 | 2,347 | 4,502 |
| 45-49 | 2,538 | 2,708 | 5,247 |
| 50-54 | 2,685 | 2,719 | 5,404 |
| 55-59 | 2,225 | 2,287 | 4,513 |
| 60-64 | 1,755 | 1,917 | 3,672 |
| 65-69 | 1,135 | 1,156 | 2,291 |
| 70-74 | 758 | 947 | 1,706 |
| 75-79 | 598 | 793 | 1,391 |
| 80-84 | 487 | 765 | 1,252 |
| 85 Plus | 506 | 1,089 | 1,595 |
Castro Valley, California Population Density
Population Density: 3,666 / mi²| Location | Population | Area | Population Density |
|---|---|---|---|
| Castro Valley, California | 62,027 | 16.92 sq mi | 3,666 / mi² |
| California | 38.8 million | 163,695.4 sq mi | 236.9 / mi² |
| United States | 321.6 million | 3,796,761.2 sq mi | 84.7 / mi² |
Castro Valley, California Historical and Projected Population
Estimated Population from 1880 to 2100Sources:
1. JRC (European Commission's Joint Research Centre) work on the GHS built-up grid
2. CIESIN (Center for International Earth Science Information Network)
3. [Link] Klein Goldewijk, K., Beusen, A., Doelman, J., and Stehfest, E.: Anthropogenic land use estimates for the Holocene – HYDE 3.2, Earth Syst. Sci. Data, 9, 927–953, https://doi.org/10.5194/essd-9-927-2017, 2017.
Neighborhoods
Business Distribution by neighborhood in Castro Valley, California Downtown Castro Valley: 41.2%
Central East: 11.2%
South: 8.5%
Castro Valley: 6.2%
Upper Castro Valley: 4.9%
Other: 28%
Business distribution by price for Castro Valley, California
Moderate: 53.7%
Inexpensive: 36.8%
Expensive: 7.1%
Very Expensive: 2.5%
Human Development Index (HDI)
Statistic composite index of life expectancy, education, and per capita income.Sources: [Link] Kummu, M., Taka, M. & Guillaume, J. Gridded global datasets for Gross Domestic Product and Human Development Index over 1990–2015. Sci Data 5, 180004 (2018) doi:10.1038/sdata.2018.4
Castro Valley, California CO2 Emissions
Carbon Dioxide (CO2) Emissions Per Capita in Tonnes Per Year| Location | CO2 Emissions | CO2 Emissions Per Capita | CO2 Emissions Intensity |
|---|---|---|---|
| Castro Valley, California | 1,074,690 tn | 17.3 tn | 63,520 tons/mi² |
| California | 625,399,867 tn | 16.1 tn | 3,820 tons/mi² |
| United States | 5,664,619,809 tn | 17.6 tn | 1,491 tons/mi² |
Castro Valley, California CO2 Emissions
| 2013 CO2 emissions (tonnes/year) | 1,074,690 tn |
| 2013 CO2 emissions (tonnes/year) per capita | 17.3 tn |
| 2013 CO2 emissions intensity (tonnes/mi²/year) |
Natural Hazards Risk
Relative risk out of 10| Drought | High (9) |
| Flood | Medium (4) |
| Earthquake | High (10) |
* Risk, particularly concerning flood or landslide, may not be for the entire area.
Sources: 1. Dilley, M., R.S. Chen, U. Deichmann, A.L. Lerner-Lam, M. Arnold, J. Agwe, P. Buys, O. Kjekstad, B. Lyon, and G. Yetman. 2005. Natural Disaster Hotspots: A Global Risk Analysis. Washington, D.C.: World Bank. https://doi.org/10.1596/0-8213-5930-4.
2. Center for Hazards and Risk Research - CHRR - Columbia University, Center for International Earth Science Information Network - CIESIN - Columbia University. 2005. Global Flood Hazard Frequency and Distribution. Palisades, NY: NASA Socioeconomic Data and Applications Center (SEDAC). https://doi.org/10.7927/H4668B3D.
3. Center for Hazards and Risk Research - CHRR - Columbia University, Center for International Earth Science Information Network - CIESIN - Columbia University. 2005. Global Earthquake Hazard Distribution - Peak Ground Acceleration. Palisades, NY: NASA Socioeconomic Data and Applications Center (SEDAC). https://doi.org/10.7927/H4BZ63ZS.
4. Center for Hazards and Risk Research - CHRR - Columbia University, Center for International Earth Science Information Network - CIESIN - Columbia University, and International Research Institute for Climate and Society - IRI - Columbia University. 2005. Global Drought Hazard Frequency and Distribution. Palisades, NY: NASA Socioeconomic Data and Applications Center (SEDAC). https://doi.org/10.7927/H4VX0DFT.
Recent Nearby Earthquakes
Magnitude 3.0 and greater| Date | Time | Magnitude | Distance | Depth | Location | Link |
|---|---|---|---|---|---|---|
| 4/2/15 | 12:06 AM | 3.61 | 14 km | 9,890 m | 1km NNW of San Ramon, California | usgs.gov |
| 3/10/15 | 10:07 AM | 3.04 | 7.7 km | 4,677 m | 2km NNE of San Leandro, California | usgs.gov |
| 9/25/11 | 8:08 PM | 3.24 | 8.5 km | 7,859 m | San Francisco Bay area, California | usgs.gov |
| 8/24/11 | 9:57 AM | 3.38 | 8 km | 8,632 m | San Francisco Bay area, California | usgs.gov |
| 8/23/11 | 11:36 PM | 3.6 | 7.8 km | 8,092 m | San Francisco Bay area, California | usgs.gov |
| 5/29/10 | 11:59 PM | 3.2 | 4 km | 5,315 m | San Francisco Bay area, California | usgs.gov |
| 5/15/10 | 10:54 AM | 3.28 | 7.4 km | 9,892 m | San Francisco Bay area, California | usgs.gov |
| 6/9/08 | 4:31 AM | 3.13 | 13.6 km | 8,186 m | San Francisco Bay area, California | usgs.gov |
| 6/6/08 | 2:02 AM | 3.5 | 13.5 km | 7,608 m | San Francisco Bay area, California | usgs.gov |
| 3/20/08 | 6:28 PM | 3.01 | 11.8 km | 10,598 m | San Francisco Bay area, California | usgs.gov |
Find historical earthquake occurrences near Castro Valley, California
Earliest Date Latest Date
Magnitude 3.0 and greater Magnitude 4.0 and greater Magnitude 5.0 and greater

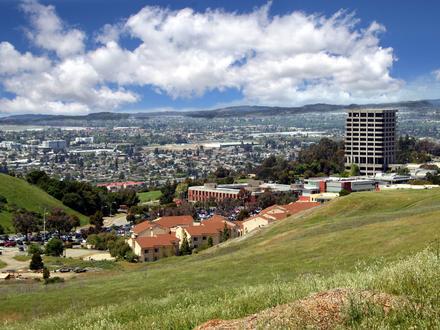
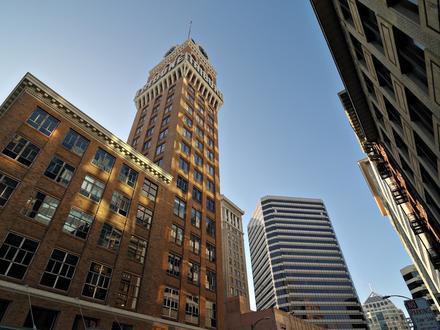
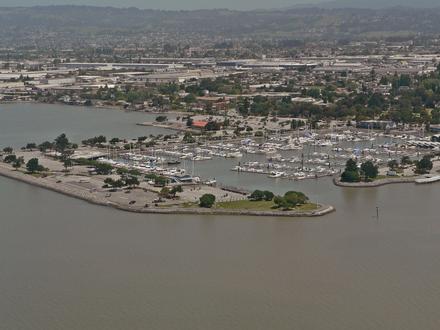
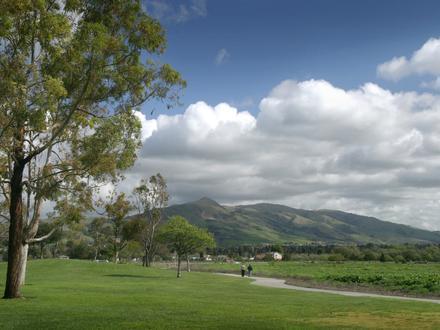
Castro Valley, California
Castro Valley is a census-designated place (CDP) in Alameda County, California, United States. As of the 2000 census, it is the fifth most populous unincorporated area in California, and the twenty-third in the United States. The population was 61,38.. Castro Valley, California Wikipedia Page
Zip Codes
Percentage of businesses by Zip Codes in Castro Valley, California Zip Code 94546: 85.1%
Zip Code 94552: 14.2%
Other: 0.7%
About Our Data
The data on this page is estimated using a number of publicly available tools and resources. It is provided without warranty, and could contain inaccuracies. Use at your own risk. See here for more information.