- World
- »
- US
- »
- New York
- »
- Champlain, New York
Businesses in Champlain, New York
Hotels & Travel
Restaurants
Automotive
Financial Services
Medical
Beauty & Spas
Community & Government

Industries
Business Distribution by Industry Shopping: 19.9%
Industry: 19.7%
Automotive: 8.4%
Professional Services: 8.3%
Community & Government: 6.2%
Restaurants: 5%
Other: 32.5%
| Industry Description | Number of Establishments | Average Age of Business | Average Google Rating | Businesses per 1,000 residents |
|---|---|---|---|---|
| Car parts | 5 | 40.7 years | 4.5 | |
| Car repair | 15 | 33.9 years | 4.4 | 13.5 |
| Gas stations | 8 | 4.2 | 7.2 | |
| New car dealers | 5 | 31.1 years | 4.5 | |
| Government agencies | 5 | 4.0 | 4.5 | |
| Public administration | 33 | 67.7 years | 4.0 | 29.8 |
| Atm's | 5 | 3.8 | 4.5 | |
| Banks | 6 | 3.6 | 5.4 | |
| Finance other | 6 | 5.4 | ||
| Loan companies | 5 | 4.5 | ||
| Convenience stores | 6 | 4.2 | 5.4 | |
| Grocery stores and supermarkets | 9 | 41.6 years | 4.3 | 8.1 |
| General contractors | 8 | 39.2 years | 7.2 | |
| Moving companies | 9 | 24.6 years | 3.2 | 8.1 |
| Construction of buildings | 7 | 35.7 years | 4.8 | 6.3 |
| Customs brokers and clearing agents | 15 | 23.9 years | 3.6 | 13.5 |
| Freight forwarding | 14 | 27.5 years | 4.4 | 12.6 |
| Freight/commercial transport | 12 | 26.6 years | 3.6 | 10.8 |
| Wholesale of machinery | 12 | 33.6 years | 4.9 | 10.8 |
| Wholesalers | 8 | 4.8 | 7.2 | |
| Health and medical | 9 | 4.1 | 8.1 | |
| Physicians and surgeons | 7 | 4.1 | 6.3 | |
| Post offices | 11 | 28.8 years | 4.7 | 9.9 |
| Corporate management | 10 | 23.8 years | 3.6 | 9.0 |
| Scientific and technical services | 11 | 27.5 years | 9.9 | |
| Churches | 5 | 65.9 years | 4.5 | 4.5 |
| Department stores | 6 | 3.9 | 5.4 | |
| Electronics stores | 9 | 41.2 years | 8.1 | |
| Hardware stores | 5 | 49.3 years | 4.5 | |
| Shopping other | 7 | 6.3 |
| Area of Champlain, New York | 58.8 sq mi |
| Population | 1,109 |
| Male Population | 520 (46.9%) |
| Female Population | 589 (53.1%) |
| Population change from 1975 to 2015 | +18.1% |
| Population change from 2000 to 2015 | +2.4% |
| Median Age | 41.2 |
| Male Median Age | 40.6 |
| Female Median Age | 41.7 |
| Area Codes | 518 |
| Local Time | Wednesday 11:33 PM |
| Timezone | Eastern Daylight Time |
| Lat & Lng | 44.98643° / -73.44653° |
Champlain, New York - Map
Champlain, New York Population
Years 1975 to 2015| Data | 1975 | 1990 | 2000 | 2015 |
|---|---|---|---|---|
| Population | 939 | 896 | 1,083 | 1,109 |
| Population Density | 16.0 / mi² | 15.2 / mi² | 18.4 / mi² | 18.9 / mi² |
Champlain, New York Population change from 2000 to 2015
Increase of 2.4% from year 2000 to 2015| Location | Change since 1975 | Change since 1990 | Change since 2000 |
|---|---|---|---|
| Champlain, New York | +18.1% | +23.8% | +2.4% |
| New York | +15.2% | +7.1% | +1.6% |
| United States | +46.9% | +27.2% | +13.7% |
Champlain, New York Median Age
Median Age: 41.2 years| Location | Median Age | Median Age (Female) | Median Age (Male) |
|---|---|---|---|
| Champlain, New York | 41.2 years | 41.7 years | 40.6 years |
| New York | 38.1 years | 39.6 years | 36.6 years |
| United States | 37.4 years | 38.7 years | 36.1 years |
Champlain, New York Population Tree
Population By Age and Gender| Age | Male | Female | Total |
|---|---|---|---|
| Under 5 | 39 | 44 | 83 |
| 5-9 | 29 | 29 | 59 |
| 10-14 | 31 | 39 | 70 |
| 15-19 | 24 | 44 | 69 |
| 20-24 | 31 | 34 | 65 |
| 25-29 | 35 | 21 | 56 |
| 30-34 | 33 | 34 | 67 |
| 35-39 | 33 | 37 | 70 |
| 40-44 | 35 | 40 | 75 |
| 45-49 | 50 | 51 | 102 |
| 50-54 | 45 | 43 | 88 |
| 55-59 | 35 | 31 | 67 |
| 60-64 | 24 | 40 | 65 |
| 65-69 | 25 | 23 | 49 |
| 70-74 | 17 | 22 | 39 |
| 75-79 | 11 | 27 | 38 |
| 80-84 | 11 | 17 | 29 |
| 85 Plus | 10 | 15 | 25 |
Champlain, New York Population Density
Population Density: 18.9 / mi²| Location | Population | Area | Population Density |
|---|---|---|---|
| Champlain, New York | 1,109 | 58.8 sq mi | 18.9 / mi² |
| New York | 19.4 million | 54,555.3 sq mi | 355.2 / mi² |
| United States | 321.6 million | 3,796,761.2 sq mi | 84.7 / mi² |
Champlain, New York Historical and Projected Population
Estimated Population from 1730 to 2100Sources:
1. JRC (European Commission's Joint Research Centre) work on the GHS built-up grid
2. CIESIN (Center for International Earth Science Information Network)
3. [Link] Klein Goldewijk, K., Beusen, A., Doelman, J., and Stehfest, E.: Anthropogenic land use estimates for the Holocene – HYDE 3.2, Earth Syst. Sci. Data, 9, 927–953, https://doi.org/10.5194/essd-9-927-2017, 2017.
Business distribution by price for Champlain, New York
Inexpensive: 58.1%
Moderate: 38.7%
Very Expensive: 3.2%
Human Development Index (HDI)
Statistic composite index of life expectancy, education, and per capita income.Sources: [Link] Kummu, M., Taka, M. & Guillaume, J. Gridded global datasets for Gross Domestic Product and Human Development Index over 1990–2015. Sci Data 5, 180004 (2018) doi:10.1038/sdata.2018.4
Champlain, New York CO2 Emissions
Carbon Dioxide (CO2) Emissions Per Capita in Tonnes Per Year| Location | CO2 Emissions | CO2 Emissions Per Capita | CO2 Emissions Intensity |
|---|---|---|---|
| Champlain, New York | 18,849 tn | 17 tn | 320.6 tons/mi² |
| New York | 334,299,374 tn | 17.3 tn | 6,127 tons/mi² |
| United States | 5,664,619,809 tn | 17.6 tn | 1,491 tons/mi² |
Champlain, New York CO2 Emissions
| 2013 CO2 emissions (tonnes/year) | 18,849 tn |
| 2013 CO2 emissions (tonnes/year) per capita | 17 tn |
| 2013 CO2 emissions intensity (tonnes/mi²/year) |
Natural Hazards Risk
Relative risk out of 10| Cyclone | Medium (5) |
| Flood | High (7) |
| Earthquake | Medium (4) |
* Risk, particularly concerning flood or landslide, may not be for the entire area.
Sources: 1. Dilley, M., R.S. Chen, U. Deichmann, A.L. Lerner-Lam, M. Arnold, J. Agwe, P. Buys, O. Kjekstad, B. Lyon, and G. Yetman. 2005. Natural Disaster Hotspots: A Global Risk Analysis. Washington, D.C.: World Bank. https://doi.org/10.1596/0-8213-5930-4.
2. Center for Hazards and Risk Research - CHRR - Columbia University, Center for International Earth Science Information Network - CIESIN - Columbia University. 2005. Global Earthquake Hazard Distribution - Peak Ground Acceleration. Palisades, NY: NASA Socioeconomic Data and Applications Center (SEDAC). https://doi.org/10.7927/H4BZ63ZS.
3. Center for Hazards and Risk Research - CHRR - Columbia University, Center for International Earth Science Information Network - CIESIN - Columbia University. 2005. Global Flood Hazard Frequency and Distribution. Palisades, NY: NASA Socioeconomic Data and Applications Center (SEDAC). https://doi.org/10.7927/H4668B3D.
4. Center for Hazards and Risk Research - CHRR - Columbia University, Center for International Earth Science Information Network - CIESIN - Columbia University, International Bank for Reconstruction and Development - The World Bank, and United Nations Environment Programme Global Resource Information Database Geneva - UNEP/GRID-Geneva. 2005. Global Cyclone Hazard Frequency and Distribution. Palisades, NY: NASA Socioeconomic Data and Applications Center (SEDAC). https://doi.org/10.7927/H4CZ353K.
Recent Nearby Earthquakes
Magnitude 3.0 and greater| Date | Time | Magnitude | Distance | Depth | Location | Link |
|---|---|---|---|---|---|---|
| 10/9/12 | 9:19 PM | 3.93 | 86.6 km | 8,550 m | southern Quebec, Canada | usgs.gov |
| 8/24/11 | 10:14 AM | 3.19 | 80.4 km | 5,000 m | New York | usgs.gov |
| 1/9/06 | 7:35 AM | 3.72 | 34.6 km | 12,690 m | southern Quebec, Canada | usgs.gov |
| 4/8/03 | 8:06 AM | 3.7 | 81.9 km | 10,000 m | New York | usgs.gov |
| 6/1/02 | 4:35 AM | 3.2 | 74.5 km | 18,000 m | southern Quebec, Canada | usgs.gov |
| 5/24/02 | 4:46 PM | 3.1 | 56.6 km | 10,000 m | New York | usgs.gov |
| 4/20/02 | 4:04 AM | 3.7 | 58.5 km | 5,000 m | New York | usgs.gov |
| 4/20/02 | 3:50 AM | 5.3 | 56.3 km | 4,830 m | New York | usgs.gov |
| 10/6/00 | 6:59 AM | 3.8 | 47.9 km | 18,000 m | Ontario-Quebec border region, Canada | usgs.gov |
| 6/9/98 | 1:53 AM | 3.3 | 34 km | 4,600 m | New York | usgs.gov |
Find historical earthquake occurrences near Champlain, New York
Earliest Date Latest Date
Magnitude 3.0 and greater Magnitude 4.0 and greater Magnitude 5.0 and greater

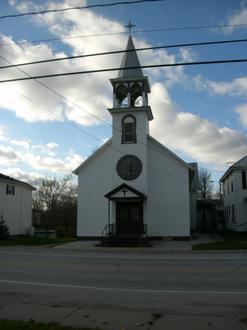
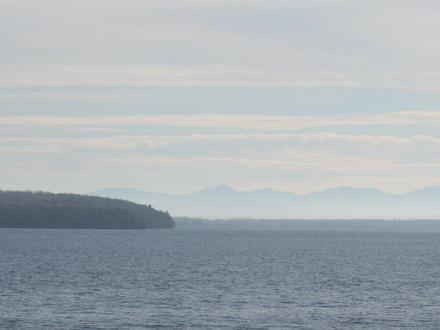
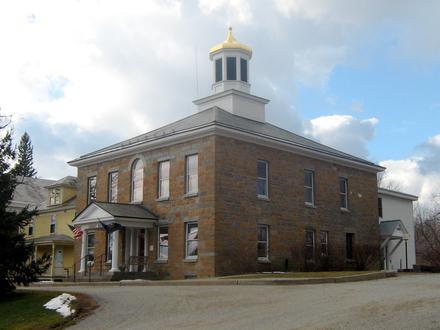
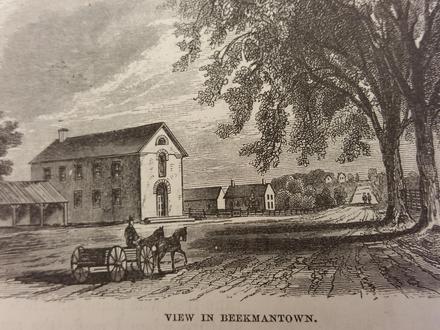
Champlain, New York
Champlain is a town in Clinton County, New York, United States. The population was 5,754 at the 2010 census. The town is located on the west shore of Lake Champlain, near the north end of the lake. town occupies the northeast corner of Clinton Count.. Champlain, New York Wikipedia Page
About Our Data
The data on this page is estimated using a number of publicly available tools and resources. It is provided without warranty, and could contain inaccuracies. Use at your own risk. See here for more information.