- World
- »
- US
- »
- Kansas
- »
- Concordia, Kansas
Businesses in Concordia, Kansas
Hotels & Travel
Restaurants
Automotive
Financial Services
Medical
Beauty & Spas
Community & Government
Industries
Business Distribution by Industry Shopping: 15.2%
Industry: 12.3%
Medical: 10.5%
Home Services: 7.3%
Professional Services: 7.2%
Community & Government: 6%
Financial Services: 5.9%
Automotive: 5.2%
Restaurants: 5%
Local Services: 4.9%
Other: 20.5%
| Industry Description | Number of Establishments | Average Age of Business | Average Google Rating | Businesses per 1,000 residents |
|---|---|---|---|---|
| Car parts | 9 | 27.9 years | 4.2 | 1.8 |
| Car repair | 21 | 35.6 years | 4.7 | 4.2 |
| Gas stations | 8 | 4.2 | 1.6 | |
| Beauty salons | 9 | 21.1 years | 4.4 | 1.8 |
| Hairdressers | 6 | 28.8 years | 4.6 | 1.2 |
| Government agencies | 15 | 70 years | 3.5 | 3.0 |
| Public administration | 33 | 37.1 years | 4.3 | 6.6 |
| Social work | 10 | 39.6 years | 1.7 | 2.0 |
| Primary and elementary schools | 6 | 40.7 years | 3.0 | 1.2 |
| Museums | 6 | 29.3 years | 4.8 | 1.2 |
| Atm's | 6 | 3.7 | 1.2 | |
| Banks | 7 | 28.5 years | 4.1 | 1.4 |
| Finance other | 10 | 43.4 years | 2.7 | 2.0 |
| Loan companies | 13 | 53.7 years | 1.3 | 2.6 |
| Grocery stores and supermarkets | 11 | 46.5 years | 4.0 | 2.2 |
| Apartments | 6 | 31.7 years | 3.5 | 1.2 |
| General contractors | 15 | 35.9 years | 4.6 | 3.0 |
| Landscaping | 6 | 4.8 | 1.2 | |
| Real estate | 13 | 42.3 years | 3.7 | 2.6 |
| Construction of buildings | 7 | 32.8 years | 5.0 | 1.4 |
| Other membership organizations | 14 | 50.6 years | 4.4 | 2.8 |
| Tractors and farm equipment | 13 | 46.3 years | 4.6 | 2.6 |
| Wholesale of machinery | 6 | 38.2 years | 4.3 | 1.2 |
| Chiropractors | 8 | 37.5 years | 5.0 | 1.6 |
| Health and medical | 45 | 29.5 years | 4.2 | 9.0 |
| Optometrists | 7 | 4.7 | 1.4 | |
| Physicians and surgeons | 27 | 29.4 years | 2.8 | 5.4 |
| Physiotherapy | 7 | 1.4 | ||
| Accountants | 9 | 36.6 years | 1.8 | |
| Lawyers legal | 8 | 34.4 years | 4.0 | 1.6 |
| Legal and financial | 8 | 43.5 years | 1.6 | |
| Churches | 22 | 66 years | 4.9 | 4.4 |
| Fast food restaurants | 6 | 53.3 years | 3.9 | 1.2 |
| Household appliances and goods | 8 | 35.1 years | 4.4 | 1.6 |
| Pharmacies and drug stores | 9 | 29.6 years | 4.8 | 1.8 |
| Area of Concordia, Kansas | 4.321 sq mi |
| Population | 5,018 |
| Male Population | 2,391 (47.7%) |
| Female Population | 2,627 (52.3%) |
| Population change from 1975 to 2015 | +64.8% |
| Population change from 2000 to 2015 | -11.7% |
| Median Age | 37 |
| Male Median Age | 31.7 |
| Female Median Age | 41.9 |
| Area Codes | 785 |
| Neighborhoods | Concordia |
| Local Time | Wednesday 10:33 PM |
| Timezone | Central Daylight Time |
| Lat & Lng | 39.57084° / -97.66254° |
| Zip Codes | 66901 |
Concordia, Kansas - Map
Concordia, Kansas Population
Years 1975 to 2015| Data | 1975 | 1990 | 2000 | 2015 |
|---|---|---|---|---|
| Population | 3,044 | 4,460 | 5,685 | 5,018 |
| Population Density | 704.5 / mi² | 1,032 / mi² | 1,315 / mi² | 1,161 / mi² |
Concordia, Kansas Population change from 2000 to 2015
Decrease of 11.7% from year 2000 to 2015| Location | Change since 1975 | Change since 1990 | Change since 2000 |
|---|---|---|---|
| Concordia, Kansas | +64.8% | +12.5% | -11.7% |
| Kansas | +30.3% | +17.3% | +8% |
| United States | +46.9% | +27.2% | +13.7% |
Concordia, Kansas Median Age
Median Age: 37 years| Location | Median Age | Median Age (Female) | Median Age (Male) |
|---|---|---|---|
| Concordia, Kansas | 37 years | 41.9 years | 31.7 years |
| Kansas | 36.1 years | 37.4 years | 34.7 years |
| United States | 37.4 years | 38.7 years | 36.1 years |
Concordia, Kansas Population Tree
Population By Age and Gender| Age | Male | Female | Total |
|---|---|---|---|
| Under 5 | 163 | 166 | 330 |
| 5-9 | 156 | 160 | 317 |
| 10-14 | 141 | 133 | 275 |
| 15-19 | 285 | 248 | 533 |
| 20-24 | 255 | 185 | 441 |
| 25-29 | 156 | 146 | 303 |
| 30-34 | 111 | 106 | 217 |
| 35-39 | 97 | 114 | 212 |
| 40-44 | 126 | 143 | 270 |
| 45-49 | 159 | 150 | 309 |
| 50-54 | 157 | 147 | 304 |
| 55-59 | 116 | 140 | 256 |
| 60-64 | 141 | 145 | 287 |
| 65-69 | 92 | 130 | 222 |
| 70-74 | 76 | 108 | 184 |
| 75-79 | 53 | 110 | 163 |
| 80-84 | 61 | 132 | 194 |
| 85 Plus | 46 | 163 | 209 |
Concordia, Kansas Population Density
Population Density: 1,161 / mi²| Location | Population | Area | Population Density |
|---|---|---|---|
| Concordia, Kansas | 5,018 | 4.321 sq mi | 1,161 / mi² |
| Kansas | 2.9 million | 82,278.7 sq mi | 35.4 / mi² |
| United States | 321.6 million | 3,796,761.2 sq mi | 84.7 / mi² |
Business distribution by price for Concordia, Kansas
Inexpensive: 56.9%
Moderate: 34.5%
Expensive: 8.6%
Human Development Index (HDI)
Statistic composite index of life expectancy, education, and per capita income.Sources: [Link] Kummu, M., Taka, M. & Guillaume, J. Gridded global datasets for Gross Domestic Product and Human Development Index over 1990–2015. Sci Data 5, 180004 (2018) doi:10.1038/sdata.2018.4
Concordia, Kansas CO2 Emissions
Carbon Dioxide (CO2) Emissions Per Capita in Tonnes Per Year| Location | CO2 Emissions | CO2 Emissions Per Capita | CO2 Emissions Intensity |
|---|---|---|---|
| Concordia, Kansas | 97,949 tn | 19.5 tn | 22,670 tons/mi² |
| Kansas | 60,730,954 tn | 20.8 tn | 738.1 tons/mi² |
| United States | 5,664,619,809 tn | 17.6 tn | 1,491 tons/mi² |
Concordia, Kansas CO2 Emissions
| 2013 CO2 emissions (tonnes/year) | 97,949 tn |
| 2013 CO2 emissions (tonnes/year) per capita | 19.5 tn |
| 2013 CO2 emissions intensity (tonnes/mi²/year) |
Natural Hazards Risk
Relative risk out of 10| Drought | High (8) |
* Risk, particularly concerning flood or landslide, may not be for the entire area.
Sources: 1. Dilley, M., R.S. Chen, U. Deichmann, A.L. Lerner-Lam, M. Arnold, J. Agwe, P. Buys, O. Kjekstad, B. Lyon, and G. Yetman. 2005. Natural Disaster Hotspots: A Global Risk Analysis. Washington, D.C.: World Bank. https://doi.org/10.1596/0-8213-5930-4.
2. Center for Hazards and Risk Research - CHRR - Columbia University, Center for International Earth Science Information Network - CIESIN - Columbia University, and International Research Institute for Climate and Society - IRI - Columbia University. 2005. Global Drought Hazard Frequency and Distribution. Palisades, NY: NASA Socioeconomic Data and Applications Center (SEDAC). https://doi.org/10.7927/H4VX0DFT.
Recent Nearby Earthquakes
Magnitude 3.0 and greater| Date | Time | Magnitude | Distance | Depth | Location | Link |
|---|---|---|---|---|---|---|
| 7/30/19 | 2:30 AM | 3.5 | 91.2 km | 5,000 m | 15km S of Solomon, Kansas | usgs.gov |
| 7/30/19 | 2:29 AM | 3.1 | 78.8 km | 5,000 m | 9km WSW of Solomon, Kansas | usgs.gov |
| 6/13/17 | 2:40 AM | 3.6 | 46.4 km | 5,000 m | 6km SE of Mankato, Kansas | usgs.gov |
| 6/12/17 | 4:32 AM | 3.7 | 43.1 km | 5,000 m | 9km SE of Mankato, Kansas | usgs.gov |
| 6/12/17 | 4:32 AM | 3.2 | 44.5 km | 5,000 m | 8km SE of Mankato, Kansas | usgs.gov |
| 6/12/17 | 4:18 AM | 3.7 | 47.6 km | 5,000 m | 5km SE of Mankato, Kansas | usgs.gov |
| 5/20/17 | 9:54 PM | 3.4 | 45.6 km | 16,129 m | 7km ESE of Mankato, Kansas | usgs.gov |
| 4/7/17 | 1:08 PM | 3.3 | 44.8 km | 13,420 m | 7km ESE of Mankato, Kansas | usgs.gov |
| 4/6/17 | 5:13 PM | 3.2 | 48.4 km | 14,500 m | 5km SE of Mankato, Kansas | usgs.gov |
| 4/4/17 | 10:54 AM | 3.4 | 50.2 km | 14,510 m | 3km SSE of Mankato, Kansas | usgs.gov |
Find historical earthquake occurrences near Concordia, Kansas
Earliest Date Latest Date
Magnitude 3.0 and greater Magnitude 4.0 and greater Magnitude 5.0 and greater

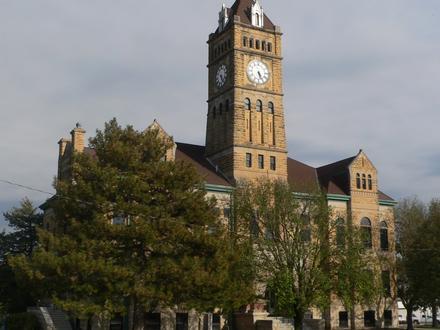
Concordia, Kansas
Concordia is a city in and the county seat of Cloud County, Kansas, United States. It is located along the Republican River in the Smoky Hills region of the Great Plains in north-central Kansas. As of the 2010 census, the city population was 5,395. C.. Concordia, Kansas Wikipedia Page
About Our Data
The data on this page is estimated using a number of publicly available tools and resources. It is provided without warranty, and could contain inaccuracies. Use at your own risk. See here for more information.