Businesses in Coplay, Pennsylvania
Hotels & Travel
Restaurants
Automotive
Financial Services
Medical
Beauty & Spas
Community & Government
Industries
Business Distribution by Industry Industry: 13.8%
Shopping: 13.6%
Professional Services: 10.2%
Home Services: 9.4%
Automotive: 8.3%
Restaurants: 7.7%
Local Services: 6.2%
Food: 5.4%
Beauty & Spas: 5.1%
Sports & Activities: 5.1%
Other: 15.1%
| Industry Description | Number of Establishments | Average Age of Business | Average Google Rating | Businesses per 1,000 residents |
|---|---|---|---|---|
| Car parts | 7 | 46 years | 3.7 | 2.3 |
| Car repair | 21 | 36.7 years | 4.4 | 6.9 |
| Beauty salons | 13 | 27.2 years | 4.7 | 4.3 |
| Hairdressers | 12 | 25 years | 4.6 | 3.9 |
| Bakeries | 5 | 4.6 | 1.6 | |
| Grocery stores and supermarkets | 13 | 52.9 years | 4.4 | 4.3 |
| General contractors | 23 | 38.1 years | 4.0 | 7.6 |
| Construction of buildings | 12 | 39.8 years | 4.1 | 3.9 |
| Other membership organizations | 6 | 34 years | 4.8 | 2.0 |
| Wholesale of construction supplies | 5 | 4.0 | 1.6 | |
| Corporate management | 7 | 27.2 years | 3.5 | 2.3 |
| Scientific and technical services | 10 | 29 years | 5.0 | 3.3 |
| American restaurants | 6 | 27.2 years | 4.4 | 2.0 |
| Area of Coplay, Pennsylvania | 0.627 sq mi |
| Population | 3,046 |
| Male Population | 1,414 (46.4%) |
| Female Population | 1,632 (53.6%) |
| Population change from 1975 to 2015 | +24.6% |
| Population change from 2000 to 2015 | +16.9% |
| Median Age | 43.6 |
| Male Median Age | 42.2 |
| Female Median Age | 44.9 |
| Area Codes | 484, 610 |
| Neighborhoods | Coplay |
| Local Time | Wednesday 11:33 PM |
| Timezone | Eastern Daylight Time |
| Lat & Lng | 40.6701° / -75.49546° |
| Zip Codes | 18003, 18037 |
Coplay, Pennsylvania - Map
Coplay, Pennsylvania Population
Years 1975 to 2015| Data | 1975 | 1990 | 2000 | 2015 |
|---|---|---|---|---|
| Population | 2,445 | 2,526 | 2,606 | 3,046 |
| Population Density | 3,899 / mi² | 4,028 / mi² | 4,156 / mi² | 4,858 / mi² |
Coplay, Pennsylvania Population change from 2000 to 2015
Increase of 16.9% from year 2000 to 2015| Location | Change since 1975 | Change since 1990 | Change since 2000 |
|---|---|---|---|
| Coplay, Pennsylvania | +24.6% | +20.6% | +16.9% |
| Pennsylvania | +19.7% | +10.4% | +3.8% |
| United States | +46.9% | +27.2% | +13.7% |
Coplay, Pennsylvania Median Age
Median Age: 43.6 years| Location | Median Age | Median Age (Female) | Median Age (Male) |
|---|---|---|---|
| Coplay, Pennsylvania | 43.6 years | 44.9 years | 42.2 years |
| Pennsylvania | 40.1 years | 41.6 years | 38.6 years |
| United States | 37.4 years | 38.7 years | 36.1 years |
Coplay, Pennsylvania Population Tree
Population By Age and Gender| Age | Male | Female | Total |
|---|---|---|---|
| Under 5 | 72 | 62 | 135 |
| 5-9 | 79 | 78 | 158 |
| 10-14 | 80 | 108 | 189 |
| 15-19 | 91 | 96 | 188 |
| 20-24 | 73 | 78 | 152 |
| 25-29 | 102 | 110 | 213 |
| 30-34 | 87 | 88 | 175 |
| 35-39 | 79 | 79 | 159 |
| 40-44 | 97 | 119 | 217 |
| 45-49 | 113 | 143 | 256 |
| 50-54 | 151 | 147 | 299 |
| 55-59 | 103 | 113 | 217 |
| 60-64 | 86 | 94 | 180 |
| 65-69 | 52 | 68 | 121 |
| 70-74 | 41 | 56 | 97 |
| 75-79 | 43 | 71 | 115 |
| 80-84 | 34 | 69 | 104 |
| 85 Plus | 28 | 53 | 82 |
Coplay, Pennsylvania Population Density
Population Density: 4,858 / mi²| Location | Population | Area | Population Density |
|---|---|---|---|
| Coplay, Pennsylvania | 3,046 | 0.627 sq mi | 4,858 / mi² |
| Pennsylvania | 12.8 million | 46,054.5 sq mi | 278.1 / mi² |
| United States | 321.6 million | 3,796,761.2 sq mi | 84.7 / mi² |
Coplay, Pennsylvania Historical and Projected Population
Estimated Population from 1810 to 2100Sources:
1. JRC (European Commission's Joint Research Centre) work on the GHS built-up grid
2. CIESIN (Center for International Earth Science Information Network)
3. [Link] Klein Goldewijk, K., Beusen, A., Doelman, J., and Stehfest, E.: Anthropogenic land use estimates for the Holocene – HYDE 3.2, Earth Syst. Sci. Data, 9, 927–953, https://doi.org/10.5194/essd-9-927-2017, 2017.
Neighborhoods
Business Distribution by neighborhood in Coplay, Pennsylvania Coplay: 83.9%
Cementon: 3.2%
Orefield: 3.2%
Southside: 3.2%
Northampton Historic District: 3.2%
Central Bethlehem Historic District: 3.2%
Business distribution by price for Coplay, Pennsylvania
Moderate: 57.6%
Inexpensive: 39.4%
Expensive: 3%
Human Development Index (HDI)
Statistic composite index of life expectancy, education, and per capita income.Sources: [Link] Kummu, M., Taka, M. & Guillaume, J. Gridded global datasets for Gross Domestic Product and Human Development Index over 1990–2015. Sci Data 5, 180004 (2018) doi:10.1038/sdata.2018.4
Coplay, Pennsylvania CO2 Emissions
Carbon Dioxide (CO2) Emissions Per Capita in Tonnes Per Year| Location | CO2 Emissions | CO2 Emissions Per Capita | CO2 Emissions Intensity |
|---|---|---|---|
| Coplay, Pennsylvania | 51,383 tn | 16.9 tn | 81,955 tons/mi² |
| Pennsylvania | 244,899,672 tn | 19.1 tn | 5,317 tons/mi² |
| United States | 5,664,619,809 tn | 17.6 tn | 1,491 tons/mi² |
Coplay, Pennsylvania CO2 Emissions
| 2013 CO2 emissions (tonnes/year) | 51,383 tn |
| 2013 CO2 emissions (tonnes/year) per capita | 16.9 tn |
| 2013 CO2 emissions intensity (tonnes/mi²/year) |
Natural Hazards Risk
Relative risk out of 10| Flood | High (9) |
| Earthquake | Low (2) |
* Risk, particularly concerning flood or landslide, may not be for the entire area.
Sources: 1. Dilley, M., R.S. Chen, U. Deichmann, A.L. Lerner-Lam, M. Arnold, J. Agwe, P. Buys, O. Kjekstad, B. Lyon, and G. Yetman. 2005. Natural Disaster Hotspots: A Global Risk Analysis. Washington, D.C.: World Bank. https://doi.org/10.1596/0-8213-5930-4.
2. Center for Hazards and Risk Research - CHRR - Columbia University, Center for International Earth Science Information Network - CIESIN - Columbia University. 2005. Global Flood Hazard Frequency and Distribution. Palisades, NY: NASA Socioeconomic Data and Applications Center (SEDAC). https://doi.org/10.7927/H4668B3D.
3. Center for Hazards and Risk Research - CHRR - Columbia University, Center for International Earth Science Information Network - CIESIN - Columbia University. 2005. Global Earthquake Hazard Distribution - Peak Ground Acceleration. Palisades, NY: NASA Socioeconomic Data and Applications Center (SEDAC). https://doi.org/10.7927/H4BZ63ZS.
Recent Nearby Earthquakes
Magnitude 3.0 and greater| Date | Time | Magnitude | Distance | Depth | Location | Link |
|---|---|---|---|---|---|---|
| 12/26/08 | 9:04 PM | 3.37 | 98.7 km | 3,610 m | Pennsylvania | usgs.gov |
| 8/26/03 | 11:24 AM | 3.1 | 33.7 km | 2,910 m | New Jersey | usgs.gov |
| 1/15/94 | 5:49 PM | 4.6 | 59.4 km | 5,000 m | Pennsylvania | usgs.gov |
| 1/15/94 | 4:42 PM | 4.2 | 57.7 km | 5,000 m | Pennsylvania | usgs.gov |
| 3/10/80 | 10:00 PM | 3.7 | 66.2 km | 5,000 m | Greater Philadelphia area, Pennsylvania | usgs.gov |
| 3/5/80 | 9:06 AM | 3.5 | 60.8 km | 5,000 m | Greater Philadelphia area, Pennsylvania | usgs.gov |
| 3/9/79 | 8:49 PM | 3.1 | 84 km | 3,000 m | New Jersey | usgs.gov |
| 5/11/64 | 11:45 PM | 4.5 | 87.9 km | 1,000 m | Pennsylvania | usgs.gov |
| 3/23/57 | 11:02 AM | 3.8 | 59.3 km | 10,000 m | New Jersey | usgs.gov |
| 9/1/95 | 3:09 AM | 4.1 | 84.6 km | None | New Jersey | usgs.gov |
Find historical earthquake occurrences near Coplay, Pennsylvania
Earliest Date Latest Date
Magnitude 3.0 and greater Magnitude 4.0 and greater Magnitude 5.0 and greater

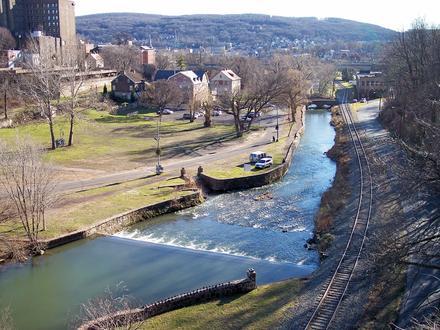
Coplay, Pennsylvania
Coplay is a borough in Lehigh County, Pennsylvania, six miles (10 km) northwest of Allentown. It is part of the Lehigh Valley region of the state. In 1900, 1,581 people lived in Coplay; in 1910, 2,670 people lived there. The population was 3,387 at t.. Coplay, Pennsylvania Wikipedia Page

About Our Data
The data on this page is estimated using a number of publicly available tools and resources. It is provided without warranty, and could contain inaccuracies. Use at your own risk. See here for more information.