- World
- »
- US
- »
- Arizona
- »
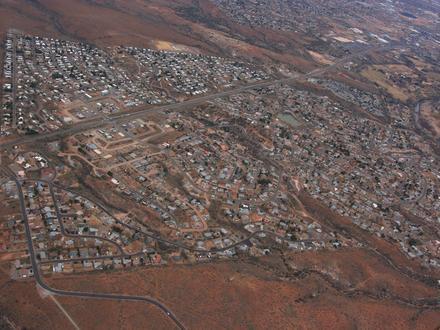
- Cornville, Arizona
Businesses in Cornville, Arizona
Hotels & Travel
Restaurants
Automotive
Financial Services
Medical
Beauty & Spas
Community & Government
Industries
Business Distribution by Industry Home Services: 13.8%
Professional Services: 13.4%
Industry: 12.3%
Shopping: 12%
Restaurants: 7.4%
Medical: 6.9%
Hotels & Travel: 6.3%
Other: 27.9%
| Industry Description | Number of Establishments | Average Age of Business | Average Google Rating | Businesses per 1,000 residents |
|---|---|---|---|---|
| General contractors | 24 | 33.2 years | 3.7 | 6.6 |
| Other construction | 13 | 35.2 years | 4.3 | 3.6 |
| Construction of buildings | 12 | 35.3 years | 4.2 | 3.3 |
| Area of Cornville, Arizona | 13.2 sq mi |
| Population | 3,645 |
| Male Population | 1,796 (49.3%) |
| Female Population | 1,849 (50.7%) |
| Population change from 1975 to 2015 | +78.9% |
| Population change from 2000 to 2015 | +39.4% |
| Median Age | 51.3 |
| Male Median Age | 51.6 |
| Female Median Age | 51 |
| Area Codes | 928 |
| Neighborhoods | Cornville, Verde Santa Fe |
| Local Time | Wednesday 8:33 PM |
| Timezone | Mountain Standard Time |
| Lat & Lng | 34.7178° / -111.92154° |
| Zip Codes | 86325 |
Cornville, Arizona - Map
Cornville, Arizona Population
Years 1975 to 2015| Data | 1975 | 1990 | 2000 | 2015 |
|---|---|---|---|---|
| Population | 2,038 | 2,271 | 2,614 | 3,645 |
| Population Density | 154.3 / mi² | 172.0 / mi² | 198.0 / mi² | 276.0 / mi² |
Cornville, Arizona Population change from 2000 to 2015
Increase of 39.4% from year 2000 to 2015| Location | Change since 1975 | Change since 1990 | Change since 2000 |
|---|---|---|---|
| Cornville, Arizona | +78.9% | +60.5% | +39.4% |
| Arizona | +146.4% | +75.2% | +37.8% |
| United States | +46.9% | +27.2% | +13.7% |
Cornville, Arizona Median Age
Median Age: 51.3 years| Location | Median Age | Median Age (Female) | Median Age (Male) |
|---|---|---|---|
| Cornville, Arizona | 51.3 years | 51 years | 51.6 years |
| Arizona | 36 years | 37.1 years | 34.8 years |
| United States | 37.4 years | 38.7 years | 36.1 years |
Cornville, Arizona Population Tree
Population By Age and Gender| Age | Male | Female | Total |
|---|---|---|---|
| Under 5 | 74 | 77 | 152 |
| 5-9 | 90 | 86 | 177 |
| 10-14 | 97 | 115 | 212 |
| 15-19 | 98 | 75 | 174 |
| 20-24 | 52 | 64 | 117 |
| 25-29 | 65 | 58 | 124 |
| 30-34 | 66 | 84 | 150 |
| 35-39 | 83 | 78 | 162 |
| 40-44 | 92 | 89 | 181 |
| 45-49 | 122 | 159 | 281 |
| 50-54 | 180 | 192 | 372 |
| 55-59 | 215 | 225 | 441 |
| 60-64 | 197 | 201 | 398 |
| 65-69 | 155 | 135 | 290 |
| 70-74 | 82 | 79 | 161 |
| 75-79 | 62 | 65 | 128 |
| 80-84 | 30 | 45 | 75 |
| 85 Plus | 35 | 23 | 58 |
Cornville, Arizona Population Density
Population Density: 276.0 / mi²| Location | Population | Area | Population Density |
|---|---|---|---|
| Cornville, Arizona | 3,645 | 13.2 sq mi | 276.0 / mi² |
| Arizona | 7.1 million | 113,991 sq mi | 62.4 / mi² |
| United States | 321.6 million | 3,796,761.2 sq mi | 84.7 / mi² |
Cornville, Arizona Historical and Projected Population
Estimated Population from 1890 to 2100Sources:
1. JRC (European Commission's Joint Research Centre) work on the GHS built-up grid
2. CIESIN (Center for International Earth Science Information Network)
3. [Link] Klein Goldewijk, K., Beusen, A., Doelman, J., and Stehfest, E.: Anthropogenic land use estimates for the Holocene – HYDE 3.2, Earth Syst. Sci. Data, 9, 927–953, https://doi.org/10.5194/essd-9-927-2017, 2017.
Neighborhoods
Business Distribution by neighborhood in Cornville, Arizona Verde Santa Fe: 75.8%
Cornville: 21.2%
White Tank Citrus: 3%
Business distribution by price for Cornville, Arizona
Moderate: 65.2%
Inexpensive: 13%
Very Expensive: 13%
Expensive: 8.7%
Human Development Index (HDI)
Statistic composite index of life expectancy, education, and per capita income.Sources: [Link] Kummu, M., Taka, M. & Guillaume, J. Gridded global datasets for Gross Domestic Product and Human Development Index over 1990–2015. Sci Data 5, 180004 (2018) doi:10.1038/sdata.2018.4
Cornville, Arizona CO2 Emissions
Carbon Dioxide (CO2) Emissions Per Capita in Tonnes Per Year| Location | CO2 Emissions | CO2 Emissions Per Capita | CO2 Emissions Intensity |
|---|---|---|---|
| Cornville, Arizona | 65,178 tn | 17.9 tn | 4,935 tons/mi² |
| Arizona | 120,455,171 tn | 16.9 tn | 1,056 tons/mi² |
| United States | 5,664,619,809 tn | 17.6 tn | 1,491 tons/mi² |
Cornville, Arizona CO2 Emissions
| 2013 CO2 emissions (tonnes/year) | 65,178 tn |
| 2013 CO2 emissions (tonnes/year) per capita | 17.9 tn |
| 2013 CO2 emissions intensity (tonnes/mi²/year) |
Natural Hazards Risk
Relative risk out of 10| Drought | High (9) |
| Earthquake | Low (2) |
* Risk, particularly concerning flood or landslide, may not be for the entire area.
Sources: 1. Dilley, M., R.S. Chen, U. Deichmann, A.L. Lerner-Lam, M. Arnold, J. Agwe, P. Buys, O. Kjekstad, B. Lyon, and G. Yetman. 2005. Natural Disaster Hotspots: A Global Risk Analysis. Washington, D.C.: World Bank. https://doi.org/10.1596/0-8213-5930-4.
2. Center for Hazards and Risk Research - CHRR - Columbia University, Center for International Earth Science Information Network - CIESIN - Columbia University. 2005. Global Earthquake Hazard Distribution - Peak Ground Acceleration. Palisades, NY: NASA Socioeconomic Data and Applications Center (SEDAC). https://doi.org/10.7927/H4BZ63ZS.
3. Center for Hazards and Risk Research - CHRR - Columbia University, Center for International Earth Science Information Network - CIESIN - Columbia University, and International Research Institute for Climate and Society - IRI - Columbia University. 2005. Global Drought Hazard Frequency and Distribution. Palisades, NY: NASA Socioeconomic Data and Applications Center (SEDAC). https://doi.org/10.7927/H4VX0DFT.
Recent Nearby Earthquakes
Magnitude 3.0 and greater| Date | Time | Magnitude | Distance | Depth | Location | Link |
|---|---|---|---|---|---|---|
| 12/30/18 | 12:31 PM | 3.2 | 93.9 km | 5,000 m | 22km E of Seligman, Arizona | usgs.gov |
| 11/4/18 | 1:31 PM | 3.1 | 61.2 km | 5,000 m | 10km ESE of Flagstaff, Arizona | usgs.gov |
| 11/1/15 | 10:49 PM | 3.6 | 70.4 km | 6,670 m | 4km NNE of Black Canyon City, Arizona | usgs.gov |
| 11/1/15 | 10:29 PM | 4 | 67.4 km | 5,920 m | 7km NNE of Black Canyon City, Arizona | usgs.gov |
| 11/1/15 | 7:59 PM | 3.2 | 66.9 km | 5,000 m | 8km N of Black Canyon City, Arizona | usgs.gov |
| 5/5/15 | 2:04 AM | 3.1 | 32.5 km | 7,120 m | 10km NNE of Sedona, Arizona | usgs.gov |
| 11/30/14 | 11:53 PM | 3.2 | 32.3 km | 5,000 m | 12km NNE of West Sedona, Arizona | usgs.gov |
| 11/30/14 | 9:57 PM | 4.7 | 40.1 km | 5,000 m | 6km SSW of Kachina Village, Arizona | usgs.gov |
| 11/25/14 | 1:19 AM | 3.5 | 29.9 km | 12,770 m | 9km N of Sedona, Arizona | usgs.gov |
| 1/8/12 | 11:11 AM | 3.2 | 90.5 km | 5,000 m | Arizona | usgs.gov |
Find historical earthquake occurrences near Cornville, Arizona
Earliest Date Latest Date
Magnitude 3.0 and greater Magnitude 4.0 and greater Magnitude 5.0 and greater

Cornville, Arizona
Cornville is a census-designated place (CDP) in Yavapai County, Arizona, United States. The population was 3,335 at the 2000 census. The Cornville CDP includes the communities of Cornville and Page Springs. and Page Springs are rapidly growing subur.. Cornville, Arizona Wikipedia Page
About Our Data
The data on this page is estimated using a number of publicly available tools and resources. It is provided without warranty, and could contain inaccuracies. Use at your own risk. See here for more information.