Businesses in Coulee City, Washington
Industries
Business Distribution by Industry Industry: 22.8%
Hotels & Travel: 11.9%
Shopping: 7.3%
Food: 6.8%
Medical: 6.8%
Education: 6.4%
Restaurants: 5.9%
Sports & Activities: 5.5%
Professional Services: 5%
Other: 21.5%
| Area of Coulee City, Washington | 0.9 sq mi |
| Population | 593 |
| Male Population | 300 (50.7%) |
| Female Population | 293 (49.3%) |
| Population change from 1975 to 2015 | +88.3% |
| Population change from 2000 to 2015 | +28.6% |
| Median Age | 49.6 |
| Male Median Age | 47.6 |
| Female Median Age | 51.6 |
| Area Codes | 509 |
| Local Time | Friday 9:51 PM |
| Timezone | Pacific Daylight Time |
| Lat & Lng | 47.61126° / -119.29225° |
| Zip Codes | 99115 |
Coulee City, Washington - Map
Coulee City, Washington Population
Years 1975 to 2015| Data | 1975 | 1990 | 2000 | 2015 |
|---|---|---|---|---|
| Population | 315 | 440 | 461 | 593 |
| Population Density | 350.1 / mi² | 489.1 / mi² | 512.4 / mi² | 659.2 / mi² |
Coulee City, Washington Population change from 2000 to 2015
Increase of 28.6% from year 2000 to 2015| Location | Change since 1975 | Change since 1990 | Change since 2000 |
|---|---|---|---|
| Coulee City, Washington | +88.3% | +34.8% | +28.6% |
| Washington | +78.3% | +41.1% | +20.1% |
| United States | +46.9% | +27.2% | +13.7% |
Coulee City, Washington Median Age
Median Age: 49.6 years| Location | Median Age | Median Age (Female) | Median Age (Male) |
|---|---|---|---|
| Coulee City, Washington | 49.6 years | 51.6 years | 47.6 years |
| Washington | 37.9 years | 38.9 years | 36.9 years |
| United States | 37.4 years | 38.7 years | 36.1 years |
Coulee City, Washington Population Tree
Population By Age and Gender| Age | Male | Female | Total |
|---|---|---|---|
| Under 5 | 10 | 13 | 24 |
| 5-9 | 16 | 18 | 34 |
| 10-14 | 16 | 7 | 24 |
| 15-19 | 19 | 13 | 33 |
| 20-24 | 19 | 8 | 28 |
| 25-29 | 12 | 14 | 27 |
| 30-34 | 17 | 12 | 29 |
| 35-39 | 15 | 11 | 27 |
| 40-44 | 13 | 18 | 31 |
| 45-49 | 23 | 22 | 46 |
| 50-54 | 27 | 30 | 58 |
| 55-59 | 19 | 21 | 41 |
| 60-64 | 28 | 25 | 53 |
| 65-69 | 22 | 27 | 50 |
| 70-74 | 9 | 17 | 26 |
| 75-79 | 20 | 12 | 33 |
| 80-84 | 11 | 14 | 25 |
| 85 Plus | 4 | 10 | 14 |
Coulee City, Washington Population Density
Population Density: 659.2 / mi²| Location | Population | Area | Population Density |
|---|---|---|---|
| Coulee City, Washington | 593 | 0.9 sq mi | 659.2 / mi² |
| Washington | 7.1 million | 71,298.4 sq mi | 99.7 / mi² |
| United States | 321.6 million | 3,796,761.2 sq mi | 84.7 / mi² |
Coulee City, Washington Historical and Projected Population
Estimated Population from 1880 to 2100Sources:
1. JRC (European Commission's Joint Research Centre) work on the GHS built-up grid
2. CIESIN (Center for International Earth Science Information Network)
3. [Link] Klein Goldewijk, K., Beusen, A., Doelman, J., and Stehfest, E.: Anthropogenic land use estimates for the Holocene – HYDE 3.2, Earth Syst. Sci. Data, 9, 927–953, https://doi.org/10.5194/essd-9-927-2017, 2017.
Business distribution by price for Coulee City, Washington
Moderate: 54.5%
Inexpensive: 27.3%
Expensive: 9.1%
Very Expensive: 9.1%
Human Development Index (HDI)
Statistic composite index of life expectancy, education, and per capita income.Sources: [Link] Kummu, M., Taka, M. & Guillaume, J. Gridded global datasets for Gross Domestic Product and Human Development Index over 1990–2015. Sci Data 5, 180004 (2018) doi:10.1038/sdata.2018.4
Coulee City, Washington CO2 Emissions
Carbon Dioxide (CO2) Emissions Per Capita in Tonnes Per Year| Location | CO2 Emissions | CO2 Emissions Per Capita | CO2 Emissions Intensity |
|---|---|---|---|
| Coulee City, Washington | 15,646 tn | 26.4 tn | 17,391 tons/mi² |
| Washington | 122,068,940 tn | 17.2 tn | 1,712 tons/mi² |
| United States | 5,664,619,809 tn | 17.6 tn | 1,491 tons/mi² |
Coulee City, Washington CO2 Emissions
| 2013 CO2 emissions (tonnes/year) | 15,646 tn |
| 2013 CO2 emissions (tonnes/year) per capita | 26.4 tn |
| 2013 CO2 emissions intensity (tonnes/mi²/year) |
Natural Hazards Risk
Relative risk out of 10| Earthquake | Low (2) |
* Risk, particularly concerning flood or landslide, may not be for the entire area.
Sources: 1. Dilley, M., R.S. Chen, U. Deichmann, A.L. Lerner-Lam, M. Arnold, J. Agwe, P. Buys, O. Kjekstad, B. Lyon, and G. Yetman. 2005. Natural Disaster Hotspots: A Global Risk Analysis. Washington, D.C.: World Bank. https://doi.org/10.1596/0-8213-5930-4.
2. Center for Hazards and Risk Research - CHRR - Columbia University, Center for International Earth Science Information Network - CIESIN - Columbia University. 2005. Global Earthquake Hazard Distribution - Peak Ground Acceleration. Palisades, NY: NASA Socioeconomic Data and Applications Center (SEDAC). https://doi.org/10.7927/H4BZ63ZS.
Recent Nearby Earthquakes
Magnitude 3.0 and greater| Date | Time | Magnitude | Distance | Depth | Location | Link |
|---|---|---|---|---|---|---|
| 6/16/19 | 9:12 AM | 3.24 | 93.1 km | 2,060 m | 11km SW of Royal City, Washington | usgs.gov |
| 7/24/17 | 12:53 PM | 3.33 | 55.5 km | 2,130 m | 7km NNE of Waterville, Washington | usgs.gov |
| 9/1/15 | 9:42 AM | 4.15 | 80 km | 9,130 m | 38km N of Coulee Dam, Washington | usgs.gov |
| 9/13/12 | 10:33 AM | 3.37 | 62.4 km | 9,292 m | Washington | usgs.gov |
| 3/25/10 | 3:31 PM | 3.2 | 33.5 km | 8,675 m | Washington | usgs.gov |
| 1/14/04 | 4:13 AM | 3.3 | 71 km | 1,207 m | Washington | usgs.gov |
| 5/10/01 | 11:25 PM | 3.3 | 42.7 km | 10,613 m | Washington | usgs.gov |
| 2/27/01 | 11:16 PM | 3.2 | 57.5 km | -581 m | Washington | usgs.gov |
| 3/16/00 | 1:44 AM | 3.2 | 1.7 km | 1,475 m | Washington | usgs.gov |
| 1/31/99 | 3:05 AM | 3.1 | 87.1 km | 9,771 m | Washington | usgs.gov |
Find historical earthquake occurrences near Coulee City, Washington
Earliest Date Latest Date
Magnitude 3.0 and greater Magnitude 4.0 and greater Magnitude 5.0 and greater

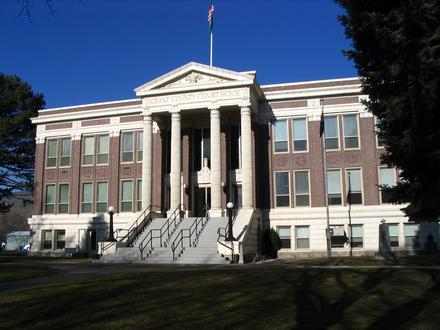
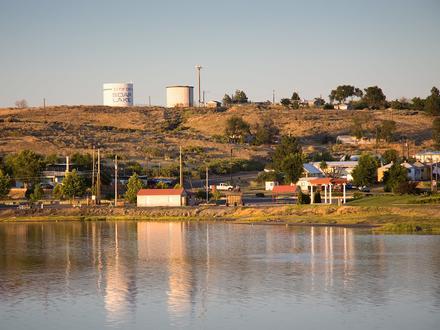
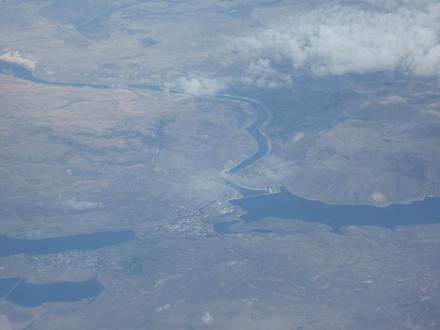
Coulee City, Washington
Coulee City is a town in Grant County, Washington, United States. The population was 562 at the 2010 census. Coulee City, Washington Wikipedia Page
About Our Data
The data on this page is estimated using a number of publicly available tools and resources. It is provided without warranty, and could contain inaccuracies. Use at your own risk. See here for more information.