- World
- »
- US
- »
- Nevada
- »
- Denio, Nevada
Businesses in Denio, Nevada
Industries
Business Distribution by Industry Shopping: 25%
Restaurants: 17.9%
Education: 14.3%
Hotels & Travel: 14.3%
Food: 7.1%
Industry: 7.1%
Professional Services: 7.1%
Home Services: 3.6%
Financial Services: 3.6%
| Area of Denio, Nevada | 16.1 sq mi |
| Population | 48 |
| Population change from 1975 to 2015 | +269.2% |
| Population change from 2000 to 2015 | +4.3% |
| Area Codes | 775 |
| Local Time | Wednesday 8:33 PM |
| Timezone | Pacific Daylight Time |
| Lat & Lng | 41.9899° / -118.63434° |
| Zip Codes | 89404 |
Denio, Nevada - Map
Denio, Nevada Population
Years 1975 to 2015| Data | 1975 | 1990 | 2000 | 2015 |
|---|---|---|---|---|
| Population | 13 | 25 | 46 | 48 |
| Population Density | 0.81 / mi² | 1.55 / mi² | 2.86 / mi² | 2.98 / mi² |
Denio, Nevada Population change from 2000 to 2015
Increase of 4.3% from year 2000 to 2015| Location | Change since 1975 | Change since 1990 | Change since 2000 |
|---|---|---|---|
| Denio, Nevada | +269.2% | +92% | +4.3% |
| Nevada | +240.2% | +114.5% | +55.2% |
| United States | +46.9% | +27.2% | +13.7% |
Denio, Nevada Population Density
Population Density: 2.98 / mi²| Location | Population | Area | Population Density |
|---|---|---|---|
| Denio, Nevada | 48 | 16.1 sq mi | 2.98 / mi² |
| Nevada | 3.1 million | 110,572.6 sq mi | 28.2 / mi² |
| United States | 321.6 million | 3,796,761.2 sq mi | 84.7 / mi² |
Denio, Nevada Historical and Projected Population
Estimated Ancient Population until 2015Sources:
1. JRC (European Commission's Joint Research Centre) work on the GHS built-up grid
2. CIESIN (Center for International Earth Science Information Network)
3. [Link] Klein Goldewijk, K., Beusen, A., Doelman, J., and Stehfest, E.: Anthropogenic land use estimates for the Holocene – HYDE 3.2, Earth Syst. Sci. Data, 9, 927–953, https://doi.org/10.5194/essd-9-927-2017, 2017.
Human Development Index (HDI)
Statistic composite index of life expectancy, education, and per capita income.Sources: [Link] Kummu, M., Taka, M. & Guillaume, J. Gridded global datasets for Gross Domestic Product and Human Development Index over 1990–2015. Sci Data 5, 180004 (2018) doi:10.1038/sdata.2018.4
Denio, Nevada CO2 Emissions
Carbon Dioxide (CO2) Emissions Per Capita in Tonnes Per Year| Location | CO2 Emissions | CO2 Emissions Per Capita | CO2 Emissions Intensity |
|---|---|---|---|
| Denio, Nevada | 682.8 tn | 14.2 tn | 42.4 tons/mi² |
| Nevada | 55,621,449 tn | 17.8 tn | 503 tons/mi² |
| United States | 5,664,619,809 tn | 17.6 tn | 1,491 tons/mi² |
Denio, Nevada CO2 Emissions
| 2013 CO2 emissions (tonnes/year) | 682.8 tn |
| 2013 CO2 emissions (tonnes/year) per capita | 14.2 tn |
| 2013 CO2 emissions intensity (tonnes/mi²/year) |
Natural Hazards Risk
Relative risk out of 10| Earthquake | Medium (4) |
* Risk, particularly concerning flood or landslide, may not be for the entire area.
Sources: 1. Dilley, M., R.S. Chen, U. Deichmann, A.L. Lerner-Lam, M. Arnold, J. Agwe, P. Buys, O. Kjekstad, B. Lyon, and G. Yetman. 2005. Natural Disaster Hotspots: A Global Risk Analysis. Washington, D.C.: World Bank. https://doi.org/10.1596/0-8213-5930-4.
2. Center for Hazards and Risk Research - CHRR - Columbia University, Center for International Earth Science Information Network - CIESIN - Columbia University. 2005. Global Earthquake Hazard Distribution - Peak Ground Acceleration. Palisades, NY: NASA Socioeconomic Data and Applications Center (SEDAC). https://doi.org/10.7927/H4BZ63ZS.
Recent Nearby Earthquakes
Magnitude 3.0 and greater| Date | Time | Magnitude | Distance | Depth | Location | Link |
|---|---|---|---|---|---|---|
| 3/8/19 | 10:55 AM | 3.3 | 49.4 km | None | 45km SSW of Denio Junction, Nevada | usgs.gov |
| 10/10/17 | 8:01 PM | 3.5 | 4.5 km | 11,100 m | 4km NE of Denio Junction, Nevada | usgs.gov |
| 3/23/16 | 7:14 PM | 3.5 | 81.1 km | 8,100 m | 68km ESE of Lakeview, Oregon | usgs.gov |
| 2/24/16 | 9:48 AM | 3.4 | 80.6 km | 9,400 m | 70km ESE of Lakeview, Oregon | usgs.gov |
| 2/20/16 | 10:24 AM | 3.1 | 81 km | 6,200 m | 68km ESE of Lakeview, Oregon | usgs.gov |
| 2/12/16 | 9:26 PM | 3.2 | 80.2 km | 9,300 m | 71km ESE of Lakeview, Oregon | usgs.gov |
| 1/3/16 | 7:35 AM | 4.1 | 81.2 km | 10,700 m | 71km ESE of Lakeview, Oregon | usgs.gov |
| 12/29/15 | 5:33 AM | 3.3 | 81.5 km | 7,200 m | 70km ESE of Lakeview, Oregon | usgs.gov |
| 12/29/15 | 5:23 AM | 3.5 | 81.7 km | 8,900 m | 70km ESE of Lakeview, Oregon | usgs.gov |
| 12/28/15 | 10:31 PM | 3.4 | 81.8 km | 9,700 m | 70km ESE of Lakeview, Oregon | usgs.gov |
Find historical earthquake occurrences near Denio, Nevada
Earliest Date Latest Date
Magnitude 3.0 and greater Magnitude 4.0 and greater Magnitude 5.0 and greater

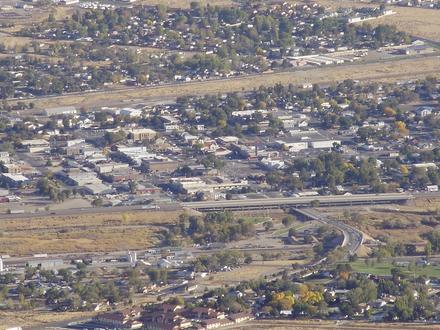
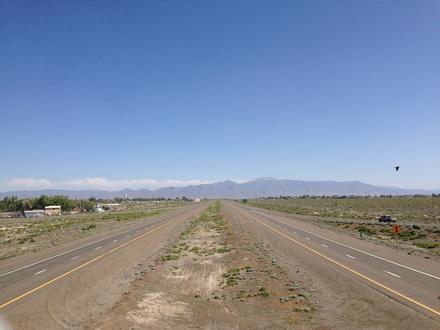
Denio, Nevada
Denio is a census-designated place (CDP) that lies on the Nevada-Oregon state line in Humboldt County, Nevada, in the United States. There was formerly a Denio post office north of the state line in Harney County, Oregon. The population of the CDP, w.. Denio, Nevada Wikipedia Page
About Our Data
The data on this page is estimated using a number of publicly available tools and resources. It is provided without warranty, and could contain inaccuracies. Use at your own risk. See here for more information.