- World
- »
- US
- »
- Arizona
- »
- Duncan, Arizona
Businesses in Duncan, Arizona
Hotels & Travel
Restaurants
Automotive
Financial Services
Medical
Beauty & Spas
Community & Government
Industries
Business Distribution by Industry Industry: 13.4%
Shopping: 13.4%
Community & Government: 10.5%
Hotels & Travel: 8.9%
Restaurants: 7.7%
Food: 6.5%
Automotive: 6.1%
Home Services: 5.7%
Religion: 4.9%
Other: 23.1%
| Industry Description | Number of Establishments | Average Age of Business | Average Google Rating | Businesses per 1,000 residents |
|---|---|---|---|---|
| Gas stations | 6 | 30.5 years | 4.3 | 8.8 |
| Public administration | 9 | 53.9 years | 4.7 | 13.3 |
| Grocery stores and supermarkets | 7 | 25.1 years | 4.4 | 10.3 |
| General contractors | 6 | 4.0 | 8.8 | |
| Churches | 6 | 54.9 years | 4.4 | 8.8 |
| Area of Duncan, Arizona | 2.548 sq mi |
| Population | 678 |
| Male Population | 348 (51.3%) |
| Female Population | 330 (48.7%) |
| Population change from 1975 to 2015 | +384.3% |
| Population change from 2000 to 2015 | -3.3% |
| Median Age | 41.9 |
| Male Median Age | 42.1 |
| Female Median Age | 41.7 |
| Area Codes | 505, 928 |
| Local Time | Wednesday 8:33 PM |
| Timezone | Mountain Standard Time |
| Lat & Lng | 32.72146° / -109.10534° |
| Zip Codes | 85534 |
Duncan, Arizona - Map
Duncan, Arizona Population
Years 1975 to 2015| Data | 1975 | 1990 | 2000 | 2015 |
|---|---|---|---|---|
| Population | 140 | 421 | 701 | 678 |
| Population Density | 54.9 / mi² | 165.2 / mi² | 275.1 / mi² | 266.1 / mi² |
Duncan, Arizona Population change from 2000 to 2015
Decrease of 3.3% from year 2000 to 2015| Location | Change since 1975 | Change since 1990 | Change since 2000 |
|---|---|---|---|
| Duncan, Arizona | +384.3% | +61% | -3.3% |
| Arizona | +146.4% | +75.2% | +37.8% |
| United States | +46.9% | +27.2% | +13.7% |
Duncan, Arizona Median Age
Median Age: 41.9 years| Location | Median Age | Median Age (Female) | Median Age (Male) |
|---|---|---|---|
| Duncan, Arizona | 41.9 years | 41.7 years | 42.1 years |
| Arizona | 36 years | 37.1 years | 34.8 years |
| United States | 37.4 years | 38.7 years | 36.1 years |
Duncan, Arizona Population Tree
Population By Age and Gender| Age | Male | Female | Total |
|---|---|---|---|
| Under 5 | 22 | 15 | 37 |
| 5-9 | 24 | 19 | 43 |
| 10-14 | 32 | 29 | 62 |
| 15-19 | 33 | 20 | 53 |
| 20-24 | 11 | 20 | 32 |
| 25-29 | 15 | 12 | 27 |
| 30-34 | 15 | 13 | 29 |
| 35-39 | 10 | 29 | 40 |
| 40-44 | 32 | 21 | 53 |
| 45-49 | 29 | 24 | 54 |
| 50-54 | 32 | 37 | 70 |
| 55-59 | 23 | 18 | 41 |
| 60-64 | 19 | 17 | 37 |
| 65-69 | 18 | 18 | 36 |
| 70-74 | 14 | 12 | 26 |
| 75-79 | 10 | 11 | 22 |
| 80-84 | 8 | 7 | 16 |
| 85 Plus | 2 | 6 | 9 |
Duncan, Arizona Population Density
Population Density: 266.1 / mi²| Location | Population | Area | Population Density |
|---|---|---|---|
| Duncan, Arizona | 678 | 2.548 sq mi | 266.1 / mi² |
| Arizona | 7.1 million | 113,991 sq mi | 62.4 / mi² |
| United States | 321.6 million | 3,796,761.2 sq mi | 84.7 / mi² |
Duncan, Arizona Historical Population
Estimated Population from 1880 to 2015Sources:
1. JRC (European Commission's Joint Research Centre) work on the GHS built-up grid
2. CIESIN (Center for International Earth Science Information Network)
3. [Link] Klein Goldewijk, K., Beusen, A., Doelman, J., and Stehfest, E.: Anthropogenic land use estimates for the Holocene – HYDE 3.2, Earth Syst. Sci. Data, 9, 927–953, https://doi.org/10.5194/essd-9-927-2017, 2017.
Business distribution by price for Duncan, Arizona
Inexpensive: 45.5%
Moderate: 36.4%
Expensive: 18.2%
Human Development Index (HDI)
Statistic composite index of life expectancy, education, and per capita income.Sources: [Link] Kummu, M., Taka, M. & Guillaume, J. Gridded global datasets for Gross Domestic Product and Human Development Index over 1990–2015. Sci Data 5, 180004 (2018) doi:10.1038/sdata.2018.4
Duncan, Arizona CO2 Emissions
Carbon Dioxide (CO2) Emissions Per Capita in Tonnes Per Year| Location | CO2 Emissions | CO2 Emissions Per Capita | CO2 Emissions Intensity |
|---|---|---|---|
| Duncan, Arizona | 11,100 tn | 16.4 tn | 4,356 tons/mi² |
| Arizona | 120,455,171 tn | 16.9 tn | 1,056 tons/mi² |
| United States | 5,664,619,809 tn | 17.6 tn | 1,491 tons/mi² |
Duncan, Arizona CO2 Emissions
| 2013 CO2 emissions (tonnes/year) | 11,100 tn |
| 2013 CO2 emissions (tonnes/year) per capita | 16.4 tn |
| 2013 CO2 emissions intensity (tonnes/mi²/year) |
Natural Hazards Risk
Relative risk out of 10| Drought | High (10) |
| Earthquake | Low (2) |
* Risk, particularly concerning flood or landslide, may not be for the entire area.
Sources: 1. Dilley, M., R.S. Chen, U. Deichmann, A.L. Lerner-Lam, M. Arnold, J. Agwe, P. Buys, O. Kjekstad, B. Lyon, and G. Yetman. 2005. Natural Disaster Hotspots: A Global Risk Analysis. Washington, D.C.: World Bank. https://doi.org/10.1596/0-8213-5930-4.
2. Center for Hazards and Risk Research - CHRR - Columbia University, Center for International Earth Science Information Network - CIESIN - Columbia University. 2005. Global Earthquake Hazard Distribution - Peak Ground Acceleration. Palisades, NY: NASA Socioeconomic Data and Applications Center (SEDAC). https://doi.org/10.7927/H4BZ63ZS.
3. Center for Hazards and Risk Research - CHRR - Columbia University, Center for International Earth Science Information Network - CIESIN - Columbia University, and International Research Institute for Climate and Society - IRI - Columbia University. 2005. Global Drought Hazard Frequency and Distribution. Palisades, NY: NASA Socioeconomic Data and Applications Center (SEDAC). https://doi.org/10.7927/H4VX0DFT.
Recent Nearby Earthquakes
Magnitude 3.0 and greater| Date | Time | Magnitude | Distance | Depth | Location | Link |
|---|---|---|---|---|---|---|
| 4/27/19 | 10:01 AM | 3.4 | 6.1 km | 10,000 m | 46km SSE of Clifton, Arizona | usgs.gov |
| 8/3/15 | 9:18 PM | 3.3 | 14.1 km | 5,000 m | 48km NW of Lordsburg, New Mexico | usgs.gov |
| 1/25/15 | 2:22 PM | 3.4 | 14.3 km | 5,000 m | 43km NW of Lordsburg, New Mexico | usgs.gov |
| 10/12/14 | 5:53 PM | 3.1 | 38.5 km | None | Arizona | usgs.gov |
| 9/25/14 | 6:41 PM | 3.1 | 8 km | 5,000 m | 48km SSE of Clifton, Arizona | usgs.gov |
| 9/15/14 | 4:55 AM | 3.5 | 30.7 km | 5,000 m | 43km WNW of Lordsburg, New Mexico | usgs.gov |
| 8/19/14 | 8:16 AM | 3.2 | 12.7 km | 5,000 m | 49km NW of Lordsburg, New Mexico | usgs.gov |
| 7/11/14 | 7:48 PM | 3.6 | 21.8 km | 5,000 m | 42km WNW of Lordsburg, New Mexico | usgs.gov |
| 7/11/14 | 10:33 AM | 3.6 | 7.8 km | 5,000 m | 46km SSE of Clifton, Arizona | usgs.gov |
| 7/11/14 | 5:41 AM | 3.5 | 16.5 km | 5,000 m | 47km WNW of Lordsburg, New Mexico | usgs.gov |
Find historical earthquake occurrences near Duncan, Arizona
Earliest Date Latest Date
Magnitude 3.0 and greater Magnitude 4.0 and greater Magnitude 5.0 and greater
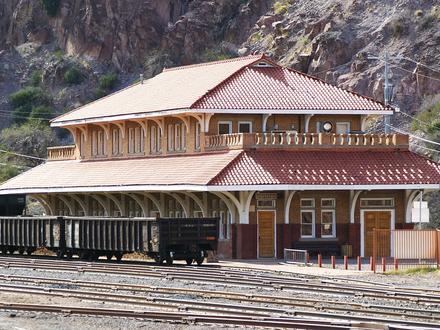
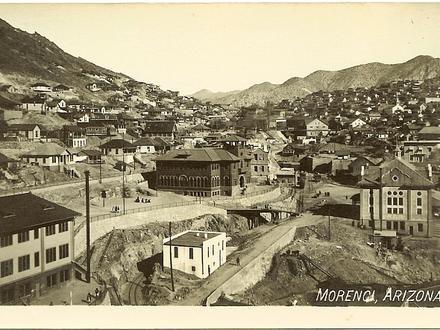
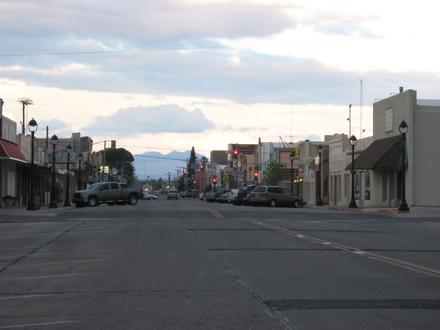
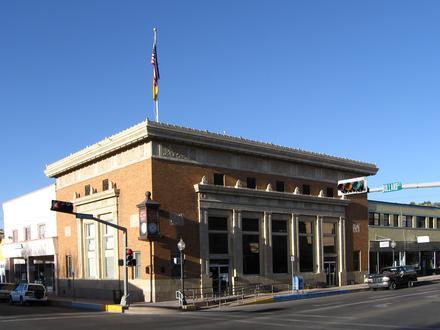
Duncan, Arizona
Duncan is a town in Greenlee County, Arizona, United States. According to the 2010 census, the population of the town is 696. Duncan is at the juncture of the Gila River and the Arizona-New Mexico state border. Duncan lies on both sides of the Gila, .. Duncan, Arizona Wikipedia Page
About Our Data
The data on this page is estimated using a number of publicly available tools and resources. It is provided without warranty, and could contain inaccuracies. Use at your own risk. See here for more information.