Businesses in Gay, Georgia
Industries
Business Distribution by Industry Home Services: 15.1%
Industry: 13.8%
Religion: 12.5%
Shopping: 11.8%
Professional Services: 9.9%
Automotive: 8.6%
Local Services: 5.9%
Sports & Activities: 5.3%
Food: 4.6%
Other: 12.5%
| Area of Gay, Georgia | 0.849 sq mi |
| Population | 88 |
| Population change from 1975 to 2015 | +166.7% |
| Population change from 2000 to 2015 | -4.3% |
| Area Codes | 706, 770 |
| Local Time | Thursday 8:59 PM |
| Timezone | Eastern Daylight Time |
| Lat & Lng | 33.09374° / -84.57382° |
| Zip Codes | 30218 |
Gay, Georgia - Map
Gay, Georgia Population
Years 1975 to 2015| Data | 1975 | 1990 | 2000 | 2015 |
|---|---|---|---|---|
| Population | 33 | 60 | 92 | 88 |
| Population Density | 38.8 / mi² | 70.6 / mi² | 108.3 / mi² | 103.6 / mi² |
Gay, Georgia Population change from 2000 to 2015
Decrease of 4.3% from year 2000 to 2015| Location | Change since 1975 | Change since 1990 | Change since 2000 |
|---|---|---|---|
| Gay, Georgia | +166.7% | +46.7% | -4.3% |
| Georgia | +93.8% | +53.1% | +27.8% |
| United States | +46.9% | +27.2% | +13.7% |
Gay, Georgia Population Density
Population Density: 103.6 / mi²| Location | Population | Area | Population Density |
|---|---|---|---|
| Gay, Georgia | 88 | 0.849 sq mi | 103.6 / mi² |
| Georgia | 10.5 million | 59,425.5 sq mi | 176.8 / mi² |
| United States | 321.6 million | 3,796,761.2 sq mi | 84.7 / mi² |
Gay, Georgia Historical Population
Estimated Population from 1710 to 2015Sources:
1. JRC (European Commission's Joint Research Centre) work on the GHS built-up grid
2. CIESIN (Center for International Earth Science Information Network)
3. [Link] Klein Goldewijk, K., Beusen, A., Doelman, J., and Stehfest, E.: Anthropogenic land use estimates for the Holocene – HYDE 3.2, Earth Syst. Sci. Data, 9, 927–953, https://doi.org/10.5194/essd-9-927-2017, 2017.
Area Codes
Percentage Area Codes used by businesses in Gay, Georgia Area Code 706: 81.8%
Area Code 770: 12.7%
Other: 5.5%
Human Development Index (HDI)
Statistic composite index of life expectancy, education, and per capita income.Sources: [Link] Kummu, M., Taka, M. & Guillaume, J. Gridded global datasets for Gross Domestic Product and Human Development Index over 1990–2015. Sci Data 5, 180004 (2018) doi:10.1038/sdata.2018.4
Gay, Georgia CO2 Emissions
Carbon Dioxide (CO2) Emissions Per Capita in Tonnes Per Year| Location | CO2 Emissions | CO2 Emissions Per Capita | CO2 Emissions Intensity |
|---|---|---|---|
| Gay, Georgia | 1,568 tn | 17.8 tn | 1,846 tons/mi² |
| Georgia | 183,571,844 tn | 17.5 tn | 3,089 tons/mi² |
| United States | 5,664,619,809 tn | 17.6 tn | 1,491 tons/mi² |
Gay, Georgia CO2 Emissions
| 2013 CO2 emissions (tonnes/year) | 1,568 tn |
| 2013 CO2 emissions (tonnes/year) per capita | 17.8 tn |
| 2013 CO2 emissions intensity (tonnes/mi²/year) |
Natural Hazards Risk
Relative risk out of 10| Flood | Medium (4) |
* Risk, particularly concerning flood or landslide, may not be for the entire area.
Sources: 1. Dilley, M., R.S. Chen, U. Deichmann, A.L. Lerner-Lam, M. Arnold, J. Agwe, P. Buys, O. Kjekstad, B. Lyon, and G. Yetman. 2005. Natural Disaster Hotspots: A Global Risk Analysis. Washington, D.C.: World Bank. https://doi.org/10.1596/0-8213-5930-4.
2. Center for Hazards and Risk Research - CHRR - Columbia University, Center for International Earth Science Information Network - CIESIN - Columbia University. 2005. Global Flood Hazard Frequency and Distribution. Palisades, NY: NASA Socioeconomic Data and Applications Center (SEDAC). https://doi.org/10.7927/H4668B3D.
Recent Nearby Earthquakes
Magnitude 3.0 and greater| Date | Time | Magnitude | Distance | Depth | Location | Link |
|---|---|---|---|---|---|---|
| 10/30/82 | 8:12 PM | 3.1 | 55.9 km | 5,000 m | Georgia, USA | usgs.gov |

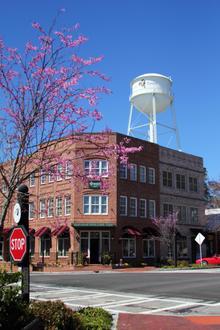
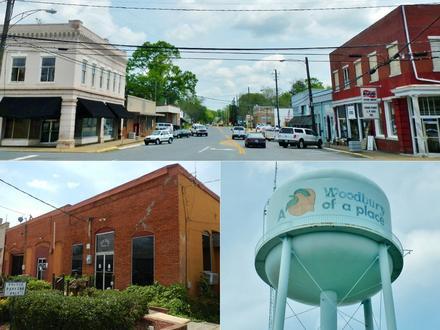
Gay, Georgia
Gay is a town in Meriwether County, Georgia, United States. The population was 89 at the 2010 census. town of Gay hosts a "Cotton Pickin' Fair" on the first weekend of every May and October. post office called Gay has been in operation since 1886. Gay, Georgia Wikipedia Page
About Our Data
The data on this page is estimated using a number of publicly available tools and resources. It is provided without warranty, and could contain inaccuracies. Use at your own risk. See here for more information.