Businesses in Healdsburg, California
Hotels & Travel
Restaurants
Automotive
Financial Services
Medical
Beauty & Spas
Community & Government
Industries
Business Distribution by Industry Shopping: 17.3%
Food: 13.8%
Professional Services: 13%
Industry: 9.2%
Medical: 8.2%
Home Services: 7.6%
Restaurants: 6.7%
Other: 24.4%
| Industry Description | Number of Establishments | Average Age of Business | Average Google Rating | Businesses per 1,000 residents |
|---|---|---|---|---|
| Car repair | 46 | 39.7 years | 4.3 | 4.1 |
| Beauty salons | 32 | 25.4 years | 4.7 | 2.8 |
| Hairdressers | 31 | 27.1 years | 4.7 | 2.7 |
| Public administration | 36 | 60.2 years | 4.9 | 3.2 |
| Art galleries | 42 | 25.2 years | 4.7 | 3.7 |
| Loan companies | 41 | 42.7 years | 3.5 | 3.6 |
| Bottled water and beverages | 46 | 30.4 years | 4.5 | 4.1 |
| Fruits and vegetables | 51 | 39.7 years | 4.5 | 4.5 |
| Grocery stores and supermarkets | 169 | 31.7 years | 4.5 | 14.9 |
| Manufacture of food, beverage and tobacco | 63 | 37 years | 4.6 | 5.6 |
| Wine, beer and liquor stores | 100 | 27.2 years | 4.4 | 8.8 |
| Wineries | 184 | 33 years | 4.6 | 16.2 |
| General contractors | 83 | 35.9 years | 4.6 | 7.3 |
| Other construction | 34 | 34 years | 5.0 | 3.0 |
| Real estate | 77 | 29.7 years | 4.2 | 6.8 |
| Hotels and motels | 42 | 36.5 years | 4.2 | 3.7 |
| Other accommodation | 45 | 37.3 years | 4.2 | 4.0 |
| Construction of buildings | 65 | 33.6 years | 4.4 | 5.7 |
| Other membership organizations | 24 | 38.5 years | 4.6 | 2.1 |
| Dentists | 40 | 35.6 years | 4.6 | 3.5 |
| Health and medical | 194 | 33 years | 3.8 | 17.1 |
| Physicians and surgeons | 60 | 40.1 years | 2.5 | 5.3 |
| Accountants | 40 | 36 years | 4.4 | 3.5 |
| Corporate management | 55 | 29.4 years | 4.8 | 4.9 |
| Lawyers legal | 38 | 32.9 years | 3.9 | 3.4 |
| Scientific and technical services | 39 | 32.4 years | 3.4 | |
| Specialized design | 55 | 32.3 years | 4.4 | 4.9 |
| Technical construction services | 25 | 33.3 years | 5.0 | 2.2 |
| Churches | 27 | 50.3 years | 4.6 | 2.4 |
| Bars, pubs and taverns | 50 | 31.6 years | 4.4 | 4.4 |
| Clothing stores | 45 | 26.2 years | 4.4 | 4.0 |
| Household appliances and goods | 25 | 31.5 years | 4.6 | 2.2 |
| Jewelers and watches | 27 | 25.3 years | 4.3 | 2.4 |
| Shopping other | 49 | 31 years | 4.3 | 4.3 |
| Women's clothing | 27 | 23 years | 4.4 | 2.4 |
| Area of Healdsburg, California | 4.464 sq mi |
| Population | 11,340 |
| Male Population | 5,552 (49%) |
| Female Population | 5,788 (51%) |
| Population change from 1975 to 2015 | +20.7% |
| Population change from 2000 to 2015 | +6.8% |
| Median Age | 41.9 |
| Male Median Age | 39.4 |
| Female Median Age | 44.3 |
| Area Codes | 707 |
| Neighborhoods | Healdsburg, North Area |
| Local Time | Monday 12:51 PM |
| Timezone | Pacific Daylight Time |
| Lat & Lng | 38.61047° / -122.86916° |
| Zip Codes | 95448 |
Healdsburg, California - Map
Healdsburg, California Population
Years 1975 to 2015| Data | 1975 | 1990 | 2000 | 2015 |
|---|---|---|---|---|
| Population | 9,394 | 9,737 | 10,622 | 11,340 |
| Population Density | 2,104 / mi² | 2,181 / mi² | 2,379 / mi² | 2,540 / mi² |
Healdsburg, California Population change from 2000 to 2015
Increase of 6.8% from year 2000 to 2015| Location | Change since 1975 | Change since 1990 | Change since 2000 |
|---|---|---|---|
| Healdsburg, California | +20.7% | +16.5% | +6.8% |
| California | +51.8% | +28.5% | +13.9% |
| United States | +46.9% | +27.2% | +13.7% |
Healdsburg, California Median Age
Median Age: 41.9 years| Location | Median Age | Median Age (Female) | Median Age (Male) |
|---|---|---|---|
| Healdsburg, California | 41.9 years | 44.3 years | 39.4 years |
| California | 35.4 years | 36.5 years | 34.2 years |
| United States | 37.4 years | 38.7 years | 36.1 years |
Healdsburg, California Population Tree
Population By Age and Gender| Age | Male | Female | Total |
|---|---|---|---|
| Under 5 | 295 | 303 | 599 |
| 5-9 | 348 | 319 | 668 |
| 10-14 | 357 | 306 | 664 |
| 15-19 | 431 | 351 | 783 |
| 20-24 | 350 | 283 | 633 |
| 25-29 | 359 | 324 | 684 |
| 30-34 | 333 | 347 | 681 |
| 35-39 | 342 | 357 | 700 |
| 40-44 | 389 | 350 | 740 |
| 45-49 | 346 | 415 | 761 |
| 50-54 | 397 | 443 | 840 |
| 55-59 | 416 | 528 | 944 |
| 60-64 | 438 | 454 | 893 |
| 65-69 | 284 | 281 | 565 |
| 70-74 | 151 | 194 | 346 |
| 75-79 | 127 | 150 | 277 |
| 80-84 | 84 | 164 | 249 |
| 85 Plus | 105 | 218 | 323 |
Healdsburg, California Population Density
Population Density: 2,540 / mi²| Location | Population | Area | Population Density |
|---|---|---|---|
| Healdsburg, California | 11,340 | 4.464 sq mi | 2,540 / mi² |
| California | 38.8 million | 163,695.4 sq mi | 236.9 / mi² |
| United States | 321.6 million | 3,796,761.2 sq mi | 84.7 / mi² |
Healdsburg, California Historical and Projected Population
Estimated Population from 1870 to 2100Sources:
1. JRC (European Commission's Joint Research Centre) work on the GHS built-up grid
2. CIESIN (Center for International Earth Science Information Network)
3. [Link] Klein Goldewijk, K., Beusen, A., Doelman, J., and Stehfest, E.: Anthropogenic land use estimates for the Holocene – HYDE 3.2, Earth Syst. Sci. Data, 9, 927–953, https://doi.org/10.5194/essd-9-927-2017, 2017.
Business distribution by price for Healdsburg, California
Moderate: 64.4%
Expensive: 18.9%
Inexpensive: 12.6%
Very Expensive: 4.1%
Human Development Index (HDI)
Statistic composite index of life expectancy, education, and per capita income.Sources: [Link] Kummu, M., Taka, M. & Guillaume, J. Gridded global datasets for Gross Domestic Product and Human Development Index over 1990–2015. Sci Data 5, 180004 (2018) doi:10.1038/sdata.2018.4
Healdsburg, California CO2 Emissions
Carbon Dioxide (CO2) Emissions Per Capita in Tonnes Per Year| Location | CO2 Emissions | CO2 Emissions Per Capita | CO2 Emissions Intensity |
|---|---|---|---|
| Healdsburg, California | 179,412 tn | 15.8 tn | 40,193 tons/mi² |
| California | 625,399,867 tn | 16.1 tn | 3,820 tons/mi² |
| United States | 5,664,619,809 tn | 17.6 tn | 1,491 tons/mi² |
Healdsburg, California CO2 Emissions
| 2013 CO2 emissions (tonnes/year) | 179,412 tn |
| 2013 CO2 emissions (tonnes/year) per capita | 15.8 tn |
| 2013 CO2 emissions intensity (tonnes/mi²/year) |
Natural Hazards Risk
Relative risk out of 10| Drought | High (9) |
| Flood | High (8) |
| Earthquake | High (9) |
* Risk, particularly concerning flood or landslide, may not be for the entire area.
Sources: 1. Dilley, M., R.S. Chen, U. Deichmann, A.L. Lerner-Lam, M. Arnold, J. Agwe, P. Buys, O. Kjekstad, B. Lyon, and G. Yetman. 2005. Natural Disaster Hotspots: A Global Risk Analysis. Washington, D.C.: World Bank. https://doi.org/10.1596/0-8213-5930-4.
2. Center for Hazards and Risk Research - CHRR - Columbia University, Center for International Earth Science Information Network - CIESIN - Columbia University, and International Research Institute for Climate and Society - IRI - Columbia University. 2005. Global Drought Hazard Frequency and Distribution. Palisades, NY: NASA Socioeconomic Data and Applications Center (SEDAC). https://doi.org/10.7927/H4VX0DFT.
3. Center for Hazards and Risk Research - CHRR - Columbia University, Center for International Earth Science Information Network - CIESIN - Columbia University. 2005. Global Earthquake Hazard Distribution - Peak Ground Acceleration. Palisades, NY: NASA Socioeconomic Data and Applications Center (SEDAC). https://doi.org/10.7927/H4BZ63ZS.
4. Center for Hazards and Risk Research - CHRR - Columbia University, Center for International Earth Science Information Network - CIESIN - Columbia University. 2005. Global Flood Hazard Frequency and Distribution. Palisades, NY: NASA Socioeconomic Data and Applications Center (SEDAC). https://doi.org/10.7927/H4668B3D.
Recent Nearby Earthquakes
Magnitude 3.0 and greater| Date | Time | Magnitude | Distance | Depth | Location | Link |
|---|---|---|---|---|---|---|
| 12/9/18 | 11:38 PM | 3.09 | 18.8 km | 1,530 m | 5km SSW of Anderson Springs, CA | usgs.gov |
| 8/31/17 | 8:59 AM | 3.52 | 14.5 km | 6,670 m | 11km WNW of Calistoga, California | usgs.gov |
| 8/13/10 | 8:51 AM | 3.19 | 21.1 km | 2,923 m | Northern California | usgs.gov |
| 6/1/10 | 12:20 AM | 3.3 | 21.1 km | 2,578 m | Northern California | usgs.gov |
| 9/17/09 | 6:02 PM | 3.12 | 15.4 km | 7,579 m | Northern California | usgs.gov |
| 9/9/08 | 5:40 AM | 3.08 | 3.2 km | 5,083 m | Northern California | usgs.gov |
| 5/29/08 | 9:48 PM | 4.14 | 20.5 km | 1,022 m | Northern California | usgs.gov |
| 1/3/04 | 8:21 AM | 3.51 | 13.8 km | 1,559 m | Northern California | usgs.gov |
| 12/19/03 | 10:29 AM | 3.35 | 18.5 km | 2,510 m | 3km SSE of The Geysers, California | usgs.gov |
| 7/29/03 | 9:50 PM | 4 | 8.7 km | 5,100 m | Northern California | usgs.gov |
Find historical earthquake occurrences near Healdsburg, California
Earliest Date Latest Date
Magnitude 3.0 and greater Magnitude 4.0 and greater Magnitude 5.0 and greater

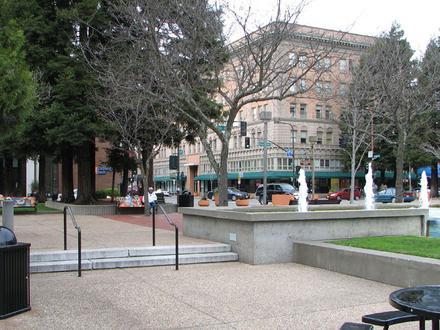
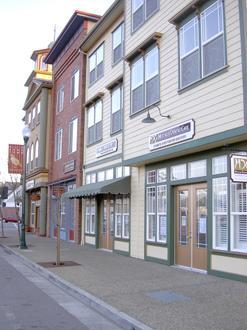
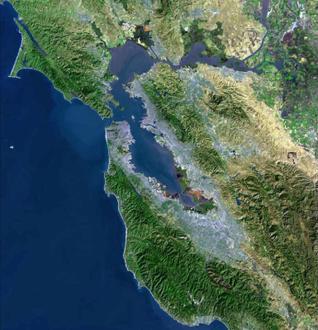
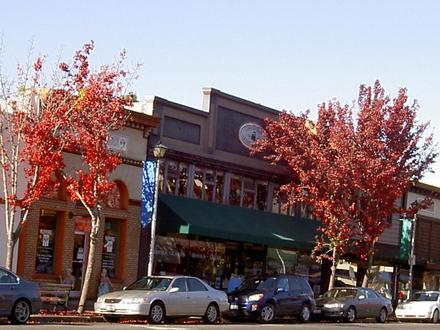
Healdsburg, California
Healdsburg is a city located in Sonoma County, California, in the United States. As of the 2010 United States Census, the city had a population of 11,254. Healdsburg is a small touristic town in northern Sonoma County. Due to its three most important.. Healdsburg, California Wikipedia Page
About Our Data
The data on this page is estimated using a number of publicly available tools and resources. It is provided without warranty, and could contain inaccuracies. Use at your own risk. See here for more information.