- World
- »
- US
- »
- Indiana
- »
- Henryville, Indiana
Businesses in Henryville, Indiana
Hotels & Travel
Restaurants
Automotive
Financial Services
Medical
Beauty & Spas
Community & Government
Industries
Business Distribution by Industry Shopping: 17.3%
Home Services: 11%
Industry: 9.5%
Religion: 9.2%
Automotive: 8.8%
Local Services: 7.1%
Professional Services: 7.1%
Restaurants: 6%
Medical: 5.3%
Other: 18.7%
| Industry Description | Number of Establishments | Average Age of Business | Average Google Rating | Businesses per 1,000 residents |
|---|---|---|---|---|
| Churches | 11 | 72.3 years | 4.8 | 5.4 |
| Area of Henryville, Indiana | 2.896 sq mi |
| Population | 2,019 |
| Male Population | 989 (49%) |
| Female Population | 1,030 (51%) |
| Population change from 1975 to 2015 | +46.3% |
| Population change from 2000 to 2015 | +20.3% |
| Median Age | 35.3 |
| Male Median Age | 33.7 |
| Female Median Age | 36.8 |
| Area Codes | 812 |
| Neighborhoods | Henryville |
| Local Time | Sunday 12:58 PM |
| Timezone | Eastern Daylight Time |
| Lat & Lng | 38.54173° / -85.76774° |
| Zip Codes | 47126 |
Henryville, Indiana - Map
Henryville, Indiana Population
Years 1975 to 2015| Data | 1975 | 1990 | 2000 | 2015 |
|---|---|---|---|---|
| Population | 1,380 | 1,525 | 1,678 | 2,019 |
| Population Density | 476.6 / mi² | 526.6 / mi² | 579.5 / mi² | 697.2 / mi² |
Henryville, Indiana Population change from 2000 to 2015
Increase of 20.3% from year 2000 to 2015| Location | Change since 1975 | Change since 1990 | Change since 2000 |
|---|---|---|---|
| Henryville, Indiana | +46.3% | +32.4% | +20.3% |
| Indiana | +33.4% | +18.8% | +8.8% |
| United States | +46.9% | +27.2% | +13.7% |
Henryville, Indiana Median Age
Median Age: 35.3 years| Location | Median Age | Median Age (Female) | Median Age (Male) |
|---|---|---|---|
| Henryville, Indiana | 35.3 years | 36.8 years | 33.7 years |
| Indiana | 37 years | 38.2 years | 35.8 years |
| United States | 37.4 years | 38.7 years | 36.1 years |
Henryville, Indiana Population Tree
Population By Age and Gender| Age | Male | Female | Total |
|---|---|---|---|
| Under 5 | 71 | 63 | 135 |
| 5-9 | 78 | 76 | 155 |
| 10-14 | 59 | 72 | 132 |
| 15-19 | 70 | 73 | 143 |
| 20-24 | 63 | 68 | 131 |
| 25-29 | 91 | 73 | 164 |
| 30-34 | 87 | 61 | 149 |
| 35-39 | 70 | 80 | 150 |
| 40-44 | 62 | 81 | 144 |
| 45-49 | 75 | 76 | 152 |
| 50-54 | 65 | 73 | 139 |
| 55-59 | 54 | 53 | 107 |
| 60-64 | 46 | 64 | 110 |
| 65-69 | 42 | 45 | 88 |
| 70-74 | 28 | 28 | 57 |
| 75-79 | 12 | 16 | 29 |
| 80-84 | 8 | 19 | 27 |
| 85 Plus | 6 | 8 | 14 |
Henryville, Indiana Population Density
Population Density: 697.2 / mi²| Location | Population | Area | Population Density |
|---|---|---|---|
| Henryville, Indiana | 2,019 | 2.896 sq mi | 697.2 / mi² |
| Indiana | 6.6 million | 36,419.7 sq mi | 182.5 / mi² |
| United States | 321.6 million | 3,796,761.2 sq mi | 84.7 / mi² |
Henryville, Indiana Projected Population
Estimated Population from 1975 to 2100Sources:
1. JRC (European Commission's Joint Research Centre) work on the GHS built-up grid
2. CIESIN (Center for International Earth Science Information Network)
3. [Link] Klein Goldewijk, K., Beusen, A., Doelman, J., and Stehfest, E.: Anthropogenic land use estimates for the Holocene – HYDE 3.2, Earth Syst. Sci. Data, 9, 927–953, https://doi.org/10.5194/essd-9-927-2017, 2017.
Area Codes
Percentage Area Codes used by businesses in Henryville, Indiana Area Code 812: 87.9%
Area Code 502: 10.1%
Other: 2%
Human Development Index (HDI)
Statistic composite index of life expectancy, education, and per capita income.Sources: [Link] Kummu, M., Taka, M. & Guillaume, J. Gridded global datasets for Gross Domestic Product and Human Development Index over 1990–2015. Sci Data 5, 180004 (2018) doi:10.1038/sdata.2018.4
Henryville, Indiana CO2 Emissions
Carbon Dioxide (CO2) Emissions Per Capita in Tonnes Per Year| Location | CO2 Emissions | CO2 Emissions Per Capita | CO2 Emissions Intensity |
|---|---|---|---|
| Henryville, Indiana | 38,408 tn | 19 tn | 13,263 tons/mi² |
| Indiana | 127,126,225 tn | 19.1 tn | 3,490 tons/mi² |
| United States | 5,664,619,809 tn | 17.6 tn | 1,491 tons/mi² |
Henryville, Indiana CO2 Emissions
| 2013 CO2 emissions (tonnes/year) | 38,408 tn |
| 2013 CO2 emissions (tonnes/year) per capita | 19 tn |
| 2013 CO2 emissions intensity (tonnes/mi²/year) |
Natural Hazards Risk
Relative risk out of 10| Flood | High (9) |
* Risk, particularly concerning flood or landslide, may not be for the entire area.
Sources: 1. Dilley, M., R.S. Chen, U. Deichmann, A.L. Lerner-Lam, M. Arnold, J. Agwe, P. Buys, O. Kjekstad, B. Lyon, and G. Yetman. 2005. Natural Disaster Hotspots: A Global Risk Analysis. Washington, D.C.: World Bank. https://doi.org/10.1596/0-8213-5930-4.
2. Center for Hazards and Risk Research - CHRR - Columbia University, Center for International Earth Science Information Network - CIESIN - Columbia University. 2005. Global Flood Hazard Frequency and Distribution. Palisades, NY: NASA Socioeconomic Data and Applications Center (SEDAC). https://doi.org/10.7927/H4668B3D.
Recent Nearby Earthquakes
Magnitude 3.0 and greater
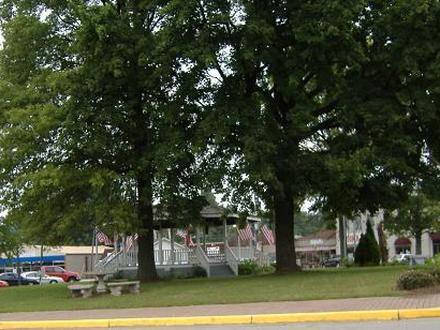
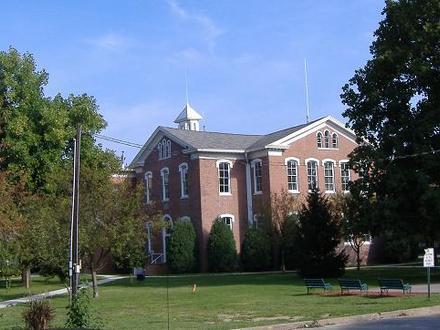
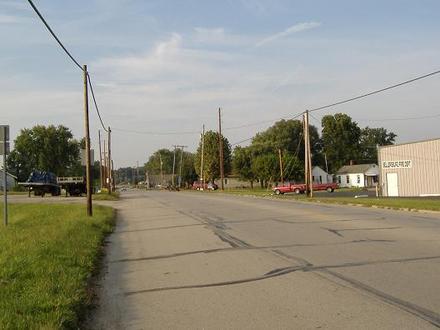
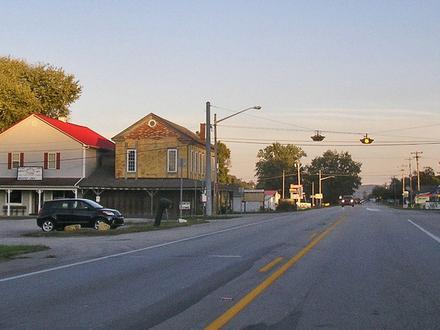
Henryville, Indiana
Henryville is a census-designated place (CDP) in Clark County, Indiana, United States. It forms part of Monroe Township. The population was 1,905 at the 2010 census. Henryville is home to Indiana's oldest state forest, Clark State Forest, and birthpl.. Henryville, Indiana Wikipedia Page
About Our Data
The data on this page is estimated using a number of publicly available tools and resources. It is provided without warranty, and could contain inaccuracies. Use at your own risk. See here for more information.