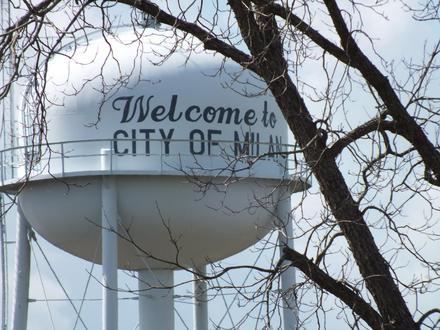
Businesses in Jacksonville, Georgia
Industries
Business Distribution by Industry Religion: 34.6%
Food: 13.5%
Industry: 11.5%
Home Services: 11.5%
Shopping: 5.8%
Professional Services: 5.8%
Restaurants: 3.8%
Hotels & Travel: 3.8%
Community & Government: 3.8%
Other: 5.8%
| Area of Jacksonville, Georgia | 1.12 sq mi |
| Population | 164 |
| Male Population | 77 (46.7%) |
| Female Population | 87 (53.3%) |
| Population change from 1975 to 2015 | +382.4% |
| Population change from 2000 to 2015 | +62.4% |
| Median Age | 45.3 |
| Male Median Age | 44.7 |
| Female Median Age | 45.9 |
| Area Codes | 229 |
| Local Time | Saturday 11:22 PM |
| Timezone | Eastern Daylight Time |
| Lat & Lng | 31.81299° / -82.98137° |
| Zip Codes | 31544 |
Jacksonville, Georgia - Map
Jacksonville, Georgia Population
Years 1975 to 2015| Data | 1975 | 1990 | 2000 | 2015 |
|---|---|---|---|---|
| Population | 34 | 70 | 101 | 164 |
| Population Density | 30.4 / mi² | 62.5 / mi² | 90.2 / mi² | 146.5 / mi² |
Jacksonville, Georgia Population change from 2000 to 2015
Increase of 62.4% from year 2000 to 2015| Location | Change since 1975 | Change since 1990 | Change since 2000 |
|---|---|---|---|
| Jacksonville, Georgia | +382.4% | +134.3% | +62.4% |
| Georgia | +93.8% | +53.1% | +27.8% |
| United States | +46.9% | +27.2% | +13.7% |
Jacksonville, Georgia Median Age
Median Age: 45.3 years| Location | Median Age | Median Age (Female) | Median Age (Male) |
|---|---|---|---|
| Jacksonville, Georgia | 45.3 years | 45.9 years | 44.7 years |
| Georgia | 35.4 years | 36.6 years | 34.2 years |
| United States | 37.4 years | 38.7 years | 36.1 years |
Jacksonville, Georgia Population Tree
Population By Age and Gender| Age | Male | Female | Total |
|---|---|---|---|
| Under 5 | 4 | 6 | 10 |
| 5-9 | 3 | 4 | 7 |
| 10-14 | 6 | 7 | 13 |
| 15-19 | 5 | 7 | 12 |
| 20-24 | 4 | 4 | 8 |
| 25-29 | 5 | 0 | 6 |
| 30-34 | 3 | 5 | 8 |
| 35-39 | 4 | 7 | 11 |
| 40-44 | 7 | 3 | 11 |
| 45-49 | 8 | 8 | 17 |
| 50-54 | 5 | 4 | 9 |
| 55-59 | 8 | 7 | 15 |
| 60-64 | 9 | 9 | 19 |
| 65-69 | 2 | 6 | 9 |
| 70-74 | 3 | 5 | 8 |
| 75-79 | 1 | 1 | 3 |
| 80-84 | 0 | 2 | 3 |
| 85 Plus | 1 | 3 | 5 |
Jacksonville, Georgia Population Density
Population Density: 146.5 / mi²| Location | Population | Area | Population Density |
|---|---|---|---|
| Jacksonville, Georgia | 164 | 1.12 sq mi | 146.5 / mi² |
| Georgia | 10.5 million | 59,425.5 sq mi | 176.8 / mi² |
| United States | 321.6 million | 3,796,761.2 sq mi | 84.7 / mi² |
Jacksonville, Georgia Historical and Projected Population
Estimated Population from 1740 to 2100Sources:
1. JRC (European Commission's Joint Research Centre) work on the GHS built-up grid
2. CIESIN (Center for International Earth Science Information Network)
3. [Link] Klein Goldewijk, K., Beusen, A., Doelman, J., and Stehfest, E.: Anthropogenic land use estimates for the Holocene – HYDE 3.2, Earth Syst. Sci. Data, 9, 927–953, https://doi.org/10.5194/essd-9-927-2017, 2017.
Human Development Index (HDI)
Statistic composite index of life expectancy, education, and per capita income.Sources: [Link] Kummu, M., Taka, M. & Guillaume, J. Gridded global datasets for Gross Domestic Product and Human Development Index over 1990–2015. Sci Data 5, 180004 (2018) doi:10.1038/sdata.2018.4
Jacksonville, Georgia CO2 Emissions
Carbon Dioxide (CO2) Emissions Per Capita in Tonnes Per Year| Location | CO2 Emissions | CO2 Emissions Per Capita | CO2 Emissions Intensity |
|---|---|---|---|
| Jacksonville, Georgia | 2,828 tn | 17.2 tn | 2,526 tons/mi² |
| Georgia | 183,571,844 tn | 17.5 tn | 3,089 tons/mi² |
| United States | 5,664,619,809 tn | 17.6 tn | 1,491 tons/mi² |
Jacksonville, Georgia CO2 Emissions
| 2013 CO2 emissions (tonnes/year) | 2,828 tn |
| 2013 CO2 emissions (tonnes/year) per capita | 17.2 tn |
| 2013 CO2 emissions intensity (tonnes/mi²/year) |
Natural Hazards Risk
Relative risk out of 10| Cyclone | High (7) |
| Flood | Medium (4) |
* Risk, particularly concerning flood or landslide, may not be for the entire area.
Sources: 1. Dilley, M., R.S. Chen, U. Deichmann, A.L. Lerner-Lam, M. Arnold, J. Agwe, P. Buys, O. Kjekstad, B. Lyon, and G. Yetman. 2005. Natural Disaster Hotspots: A Global Risk Analysis. Washington, D.C.: World Bank. https://doi.org/10.1596/0-8213-5930-4.
2. Center for Hazards and Risk Research - CHRR - Columbia University, Center for International Earth Science Information Network - CIESIN - Columbia University. 2005. Global Flood Hazard Frequency and Distribution. Palisades, NY: NASA Socioeconomic Data and Applications Center (SEDAC). https://doi.org/10.7927/H4668B3D.
3. Center for Hazards and Risk Research - CHRR - Columbia University, Center for International Earth Science Information Network - CIESIN - Columbia University, International Bank for Reconstruction and Development - The World Bank, and United Nations Environment Programme Global Resource Information Database Geneva - UNEP/GRID-Geneva. 2005. Global Cyclone Hazard Frequency and Distribution. Palisades, NY: NASA Socioeconomic Data and Applications Center (SEDAC). https://doi.org/10.7927/H4CZ353K.
Recent Nearby Earthquakes
Magnitude 3.0 and greater
Jacksonville, Georgia
Jacksonville is a town in Telfair County, Georgia, United States. The population was 140 at the 2010 census. Jacksonville, Georgia Wikipedia Page
About Our Data
The data on this page is estimated using a number of publicly available tools and resources. It is provided without warranty, and could contain inaccuracies. Use at your own risk. See here for more information.