- World
- »
- US
- »
- Oregon
- »
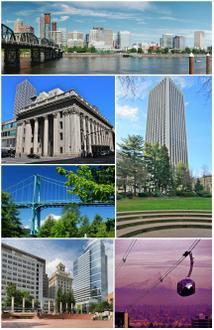
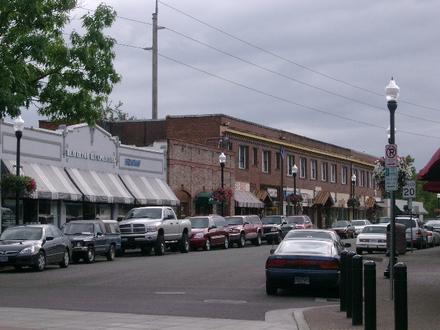
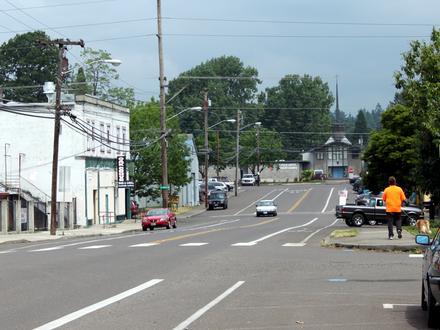
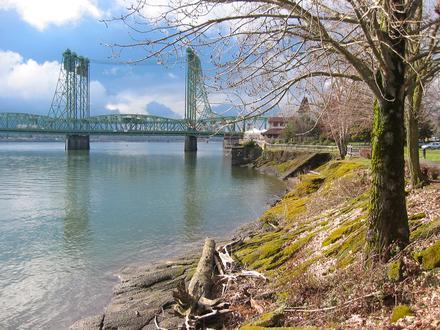
- Lake Oswego, Oregon
Businesses in Lake Oswego, Oregon
Hotels & Travel
Restaurants
Automotive
Financial Services
Medical
Beauty & Spas
Community & Government
Industries
Business Distribution by Industry Professional Services: 20.1%
Shopping: 13.8%
Medical: 12.8%
Financial Services: 12.3%
Home Services: 10.1%
Industry: 7.1%
Other: 23.9%
| Industry Description | Number of Establishments | Average Age of Business | Average Google Rating | Businesses per 1,000 residents |
|---|---|---|---|---|
| Car repair | 61 | 40.8 years | 4.4 | 1.6 |
| Beauty salons | 79 | 24.8 years | 4.6 | 2.1 |
| Hairdressers | 85 | 23.9 years | 4.6 | 2.2 |
| Social work | 106 | 28.7 years | 4.7 | 2.8 |
| Education other | 70 | 23.8 years | 4.6 | 1.8 |
| Banks | 75 | 68.9 years | 3.9 | 2.0 |
| Finance other | 157 | 40.6 years | 3.9 | 4.1 |
| Loan companies | 384 | 29.2 years | 4.6 | 10.1 |
| General contractors | 195 | 28 years | 4.3 | 5.1 |
| Other construction | 99 | 37.1 years | 4.1 | 2.6 |
| Real estate | 380 | 29.7 years | 3.9 | 10.0 |
| Construction of buildings | 165 | 30.8 years | 4.2 | 4.3 |
| Other membership organizations | 56 | 35.8 years | 4.1 | 1.5 |
| Wholesale of construction supplies | 60 | 36.4 years | 4.4 | 1.6 |
| Wholesale of machinery | 76 | 31.8 years | 4.3 | 2.0 |
| Personal services | 59 | 25.9 years | 4.4 | 1.6 |
| Dentists | 104 | 29.7 years | 4.1 | 2.7 |
| Health and medical | 680 | 28.6 years | 4.4 | 17.9 |
| Physicians and surgeons | 159 | 29 years | 4.0 | 4.2 |
| Psychiatrists and psychotherapists | 73 | 27.4 years | 4.1 | 1.9 |
| Accountants | 121 | 28.6 years | 3.9 | 3.2 |
| Advertising and marketing | 92 | 24.4 years | 4.6 | 2.4 |
| Business services | 79 | 26.8 years | 4.3 | 2.1 |
| Computer programming, web design | 55 | 26.6 years | 4.8 | 1.4 |
| Corporate management | 324 | 25.6 years | 4.0 | 8.5 |
| Lawyers legal | 307 | 25.9 years | 4.5 | 8.1 |
| Legal and financial | 83 | 36 years | 4.6 | 2.2 |
| Scientific and technical services | 207 | 25.3 years | 3.6 | 5.4 |
| Specialized design | 104 | 26 years | 4.6 | 2.7 |
| Technical construction services | 61 | 30.8 years | 5.0 | 1.6 |
| Electronics stores | 132 | 26.7 years | 4.4 | 3.5 |
| Hardware stores | 75 | 33.8 years | 4.5 | 2.0 |
| Shopping other | 81 | 34.7 years | 4.4 | 2.1 |
| Area of Lake Oswego, Oregon | 11.35 sq mi |
| Population | 38,048 |
| Male Population | 18,144 (47.7%) |
| Female Population | 19,904 (52.3%) |
| Population change from 1975 to 2015 | +52.3% |
| Population change from 2000 to 2015 | +15.3% |
| Median Age | 45.6 |
| Male Median Age | 44 |
| Female Median Age | 47 |
| Area Codes | 503, 509 |
| Neighborhoods | Evergreen, First Addition, Foothills, Lake Forest, Lake Grove, Metzger, Mount Park, Rosewood, Walluga, Westlake |
| Local Time | Thursday 5:59 PM |
| Timezone | Pacific Daylight Time |
| Lat & Lng | 45.42067° / -122.67065° |
| Zip Codes | 97034, 97035 |
Lake Oswego, Oregon - Map
Lake Oswego, Oregon Population
Years 1975 to 2015| Data | 1975 | 1990 | 2000 | 2015 |
|---|---|---|---|---|
| Population | 24,977 | 28,445 | 32,992 | 38,048 |
| Population Density | 2,200 / mi² | 2,505 / mi² | 2,906 / mi² | 3,351 / mi² |
Lake Oswego, Oregon Population change from 2000 to 2015
Increase of 15.3% from year 2000 to 2015| Location | Change since 1975 | Change since 1990 | Change since 2000 |
|---|---|---|---|
| Lake Oswego, Oregon | +52.3% | +33.8% | +15.3% |
| Oregon | +65% | +34.6% | +16.8% |
| United States | +46.9% | +27.2% | +13.7% |
Lake Oswego, Oregon Median Age
Median Age: 45.6 years| Location | Median Age | Median Age (Female) | Median Age (Male) |
|---|---|---|---|
| Lake Oswego, Oregon | 45.6 years | 47 years | 44 years |
| Oregon | 38.5 years | 39.6 years | 37.3 years |
| United States | 37.4 years | 38.7 years | 36.1 years |
Lake Oswego, Oregon Population Tree
Population By Age and Gender| Age | Male | Female | Total |
|---|---|---|---|
| Under 5 | 822 | 762 | 1,585 |
| 5-9 | 1,172 | 1,094 | 2,267 |
| 10-14 | 1,443 | 1,325 | 2,768 |
| 15-19 | 1,302 | 1,228 | 2,530 |
| 20-24 | 765 | 718 | 1,483 |
| 25-29 | 875 | 892 | 1,767 |
| 30-34 | 729 | 784 | 1,513 |
| 35-39 | 984 | 1,103 | 2,088 |
| 40-44 | 1,213 | 1,370 | 2,584 |
| 45-49 | 1,470 | 1,698 | 3,169 |
| 50-54 | 1,669 | 1,995 | 3,664 |
| 55-59 | 1,638 | 1,898 | 3,537 |
| 60-64 | 1,491 | 1,605 | 3,097 |
| 65-69 | 993 | 1,033 | 2,027 |
| 70-74 | 573 | 694 | 1,268 |
| 75-79 | 388 | 500 | 889 |
| 80-84 | 313 | 503 | 816 |
| 85 Plus | 303 | 701 | 1,005 |
Lake Oswego, Oregon Population Density
Population Density: 3,351 / mi²| Location | Population | Area | Population Density |
|---|---|---|---|
| Lake Oswego, Oregon | 38,048 | 11.35 sq mi | 3,351 / mi² |
| Oregon | 4.0 million | 98,379.3 sq mi | 40.8 / mi² |
| United States | 321.6 million | 3,796,761.2 sq mi | 84.7 / mi² |
Lake Oswego, Oregon Historical and Projected Population
Estimated Population from 1880 to 2100Sources:
1. JRC (European Commission's Joint Research Centre) work on the GHS built-up grid
2. CIESIN (Center for International Earth Science Information Network)
3. [Link] Klein Goldewijk, K., Beusen, A., Doelman, J., and Stehfest, E.: Anthropogenic land use estimates for the Holocene – HYDE 3.2, Earth Syst. Sci. Data, 9, 927–953, https://doi.org/10.5194/essd-9-927-2017, 2017.
Neighborhoods
Business Distribution by neighborhood in Lake Oswego, Oregon Lake Forest: 22.2%
Walluga: 12.7%
First Addition: 7.8%
Westlake: 7.6%
Lake Grove: 6.1%
Mount Park: 5.7%
Other: 37.8%
Business distribution by price for Lake Oswego, Oregon
Moderate: 58.4%
Inexpensive: 22%
Expensive: 15.1%
Very Expensive: 4.6%
Human Development Index (HDI)
Statistic composite index of life expectancy, education, and per capita income.Sources: [Link] Kummu, M., Taka, M. & Guillaume, J. Gridded global datasets for Gross Domestic Product and Human Development Index over 1990–2015. Sci Data 5, 180004 (2018) doi:10.1038/sdata.2018.4
Lake Oswego, Oregon CO2 Emissions
Carbon Dioxide (CO2) Emissions Per Capita in Tonnes Per Year| Location | CO2 Emissions | CO2 Emissions Per Capita | CO2 Emissions Intensity |
|---|---|---|---|
| Lake Oswego, Oregon | 759,274 tn | 20 tn | 66,887 tons/mi² |
| Oregon | 70,678,562 tn | 17.6 tn | 718.4 tons/mi² |
| United States | 5,664,619,809 tn | 17.6 tn | 1,491 tons/mi² |
Lake Oswego, Oregon CO2 Emissions
| 2013 CO2 emissions (tonnes/year) | 759,274 tn |
| 2013 CO2 emissions (tonnes/year) per capita | 20 tn |
| 2013 CO2 emissions intensity (tonnes/mi²/year) |
Natural Hazards Risk
Relative risk out of 10| Drought | Low (2) |
| Earthquake | Medium (6) |
* Risk, particularly concerning flood or landslide, may not be for the entire area.
Sources: 1. Dilley, M., R.S. Chen, U. Deichmann, A.L. Lerner-Lam, M. Arnold, J. Agwe, P. Buys, O. Kjekstad, B. Lyon, and G. Yetman. 2005. Natural Disaster Hotspots: A Global Risk Analysis. Washington, D.C.: World Bank. https://doi.org/10.1596/0-8213-5930-4.
2. Center for Hazards and Risk Research - CHRR - Columbia University, Center for International Earth Science Information Network - CIESIN - Columbia University. 2005. Global Earthquake Hazard Distribution - Peak Ground Acceleration. Palisades, NY: NASA Socioeconomic Data and Applications Center (SEDAC). https://doi.org/10.7927/H4BZ63ZS.
3. Center for Hazards and Risk Research - CHRR - Columbia University, Center for International Earth Science Information Network - CIESIN - Columbia University, and International Research Institute for Climate and Society - IRI - Columbia University. 2005. Global Drought Hazard Frequency and Distribution. Palisades, NY: NASA Socioeconomic Data and Applications Center (SEDAC). https://doi.org/10.7927/H4VX0DFT.
Recent Nearby Earthquakes
Magnitude 3.0 and greater| Date | Time | Magnitude | Distance | Depth | Location | Link |
|---|---|---|---|---|---|---|
| 4/14/18 | 8:45 PM | 3.08 | 53.2 km | 18,380 m | 6km SSE of Silverton, Oregon | usgs.gov |
| 12/13/17 | 5:24 PM | 3.96 | 43.2 km | 17,370 m | 12km S of Molalla, Oregon | usgs.gov |
| 10/3/16 | 9:29 PM | 3.03 | 34.3 km | 23,700 m | 4km WNW of Woodburn, Oregon | usgs.gov |
| 7/16/16 | 6:16 PM | 3.03 | 12.7 km | 26,650 m | 1km SSW of Beaverton, Oregon | usgs.gov |
| 6/25/15 | 6:24 AM | 3.13 | 60.7 km | 51,602 m | 25km NW of Yamhill, Oregon | usgs.gov |
| 4/6/14 | 8:33 PM | 3.32 | 18.5 km | 19,387 m | 6km NW of Sherwood, Oregon | usgs.gov |
| 1/30/13 | 5:03 PM | 3.66 | 59.1 km | 6,447 m | 3km ENE of Amboy, Washington | usgs.gov |
| 11/19/12 | 6:15 AM | 3.16 | 25.8 km | 19,797 m | Portland urban area, Oregon | usgs.gov |
| 9/7/12 | 9:57 PM | 3.54 | 33.4 km | 23,810 m | Oregon | usgs.gov |
| 9/23/07 | 11:20 PM | 3.6 | 45.2 km | 23,430 m | Oregon | usgs.gov |
Find historical earthquake occurrences near Lake Oswego, Oregon
Earliest Date Latest Date
Magnitude 3.0 and greater Magnitude 4.0 and greater Magnitude 5.0 and greater

Lake Oswego, Oregon
Lake Oswego /ɒsˈwiːɡoʊ/ is a city in the State of Oregon, primarily in Clackamas County with small portions extending into neighboring Multnomah and Washington counties. Located south of Portland surrounding the 405-acre (1.64 km2) Oswego Lake, the t.. Lake Oswego, Oregon Wikipedia Page
Zip Codes
Percentage of businesses by Zip Codes in Lake Oswego, Oregon Zip Code 97035: 70.5%
Zip Code 97034: 29.2%
Other: 0.3%
About Our Data
The data on this page is estimated using a number of publicly available tools and resources. It is provided without warranty, and could contain inaccuracies. Use at your own risk. See here for more information.