- World
- »
- US
- »
- Illinois
- »
- Lockport, Illinois
Businesses in Lockport, Illinois
Hotels & Travel
Restaurants
Automotive
Financial Services
Medical
Beauty & Spas
Community & Government
Industries
Business Distribution by Industry Shopping: 14%
Professional Services: 12.9%
Home Services: 12.2%
Industry: 11.4%
Automotive: 8.5%
Medical: 7.1%
Restaurants: 6.5%
Local Services: 5%
Other: 22.4%
| Industry Description | Number of Establishments | Average Age of Business | Average Google Rating | Businesses per 1,000 residents |
|---|---|---|---|---|
| Body repair | 24 | 21.2 years | 4.0 | 0.8 |
| Car parts | 25 | 36.2 years | 4.1 | 0.9 |
| Car repair | 88 | 24.5 years | 4.1 | 3.1 |
| Gas stations | 24 | 27.6 years | 3.8 | 0.8 |
| Beauty salons | 19 | 28 years | 4.5 | 0.7 |
| Hairdressers | 23 | 31.5 years | 4.2 | 0.8 |
| Public administration | 24 | 64.3 years | 2.9 | 0.8 |
| Atm's | 24 | 42.1 years | 3.8 | 0.8 |
| Banks | 18 | 31.1 years | 4.0 | 0.6 |
| Finance other | 23 | 39.7 years | 4.2 | 0.8 |
| Loan companies | 34 | 40.3 years | 3.6 | 1.2 |
| Grocery stores and supermarkets | 20 | 35.4 years | 4.0 | 0.7 |
| General cleaning services | 17 | 25.7 years | 5.0 | 0.6 |
| General contractors | 115 | 28.2 years | 4.2 | 4.0 |
| Landscaping | 30 | 26.6 years | 4.0 | 1.1 |
| Moving companies | 25 | 21.5 years | 4.1 | 0.9 |
| Other construction | 56 | 31 years | 4.5 | 2.0 |
| Real estate | 38 | 25.4 years | 3.5 | 1.3 |
| Construction of buildings | 60 | 33.6 years | 4.3 | 2.1 |
| Freight/commercial transport | 29 | 22.9 years | 4.1 | 1.0 |
| Other membership organizations | 20 | 50.3 years | 4.5 | 0.7 |
| Wholesale of machinery | 23 | 36.1 years | 4.1 | 0.8 |
| Photography | 19 | 27.4 years | 4.8 | 0.7 |
| Dentists | 25 | 32.6 years | 4.6 | 0.9 |
| Health and medical | 106 | 27.6 years | 4.0 | 3.7 |
| Physicians and surgeons | 20 | 3.7 | 0.7 | |
| Physiotherapy | 17 | 25.1 years | 4.4 | 0.6 |
| Advertising and marketing | 17 | 27.9 years | 5.0 | 0.6 |
| Corporate management | 25 | 23.2 years | 4.1 | 0.9 |
| Lawyers legal | 29 | 24.7 years | 3.9 | 1.0 |
| Scientific and technical services | 46 | 27.7 years | 4.4 | 1.6 |
| Specialized design | 21 | 26.6 years | 3.3 | 0.7 |
| Churches | 36 | 64.9 years | 4.6 | 1.3 |
| Bars, pubs and taverns | 17 | 23.7 years | 4.2 | 0.6 |
| Electronics stores | 27 | 28.3 years | 3.8 | 0.9 |
| Hardware stores | 19 | 31.8 years | 4.7 | 0.7 |
| Household appliances and goods | 19 | 32.9 years | 4.7 | 0.7 |
| Shopping other | 22 | 22.8 years | 4.0 | 0.8 |
| Public parks | 24 | 76.8 years | 4.5 | 0.8 |
| Area of Lockport, Illinois | 11.34 sq mi |
| Population | 28,481 |
| Male Population | 14,122 (49.6%) |
| Female Population | 14,359 (50.4%) |
| Population change from 1975 to 2015 | +11.3% |
| Population change from 2000 to 2015 | +54.7% |
| Median Age | 34.3 |
| Male Median Age | 33.5 |
| Female Median Age | 35.1 |
| Area Codes | 630, 708, 815 |
| Neighborhoods | Heritage Lakes, Lockport, Rockdale Junction |
| Local Time | Wednesday 10:33 PM |
| Timezone | Central Daylight Time |
| Lat & Lng | 41.58948° / -88.05784° |
| Zip Codes | 60441 |
Lockport, Illinois - Map
Lockport, Illinois Population
Years 1975 to 2015| Data | 1975 | 1990 | 2000 | 2015 |
|---|---|---|---|---|
| Population | 25,592 | 22,231 | 18,414 | 28,481 |
| Population Density | 2,257 / mi² | 1,960 / mi² | 1,624 / mi² | 2,512 / mi² |
Lockport, Illinois Population change from 2000 to 2015
Increase of 54.7% from year 2000 to 2015| Location | Change since 1975 | Change since 1990 | Change since 2000 |
|---|---|---|---|
| Lockport, Illinois | +11.3% | +28.1% | +54.7% |
| Illinois | +16.7% | +9.7% | +3.9% |
| United States | +46.9% | +27.2% | +13.7% |
Lockport, Illinois Median Age
Median Age: 34.3 years| Location | Median Age | Median Age (Female) | Median Age (Male) |
|---|---|---|---|
| Lockport, Illinois | 34.3 years | 35.1 years | 33.5 years |
| Illinois | 36.6 years | 37.9 years | 35.3 years |
| United States | 37.4 years | 38.7 years | 36.1 years |
Lockport, Illinois Population Tree
Population By Age and Gender| Age | Male | Female | Total |
|---|---|---|---|
| Under 5 | 1,162 | 1,162 | 2,324 |
| 5-9 | 1,280 | 1,152 | 2,433 |
| 10-14 | 1,094 | 1,026 | 2,120 |
| 15-19 | 974 | 948 | 1,922 |
| 20-24 | 733 | 639 | 1,373 |
| 25-29 | 1,038 | 1,035 | 2,073 |
| 30-34 | 1,126 | 1,192 | 2,318 |
| 35-39 | 1,166 | 1,192 | 2,359 |
| 40-44 | 1,148 | 1,150 | 2,298 |
| 45-49 | 1,158 | 1,137 | 2,296 |
| 50-54 | 978 | 964 | 1,942 |
| 55-59 | 699 | 707 | 1,406 |
| 60-64 | 577 | 613 | 1,190 |
| 65-69 | 349 | 436 | 786 |
| 70-74 | 248 | 326 | 575 |
| 75-79 | 150 | 255 | 405 |
| 80-84 | 147 | 210 | 357 |
| 85 Plus | 96 | 216 | 313 |
Lockport, Illinois Population Density
Population Density: 2,512 / mi²| Location | Population | Area | Population Density |
|---|---|---|---|
| Lockport, Illinois | 28,481 | 11.34 sq mi | 2,512 / mi² |
| Illinois | 13.0 million | 57,913.8 sq mi | 224.0 / mi² |
| United States | 321.6 million | 3,796,761.2 sq mi | 84.7 / mi² |
Lockport, Illinois Historical and Projected Population
Estimated Population from 1840 to 2100Sources:
1. JRC (European Commission's Joint Research Centre) work on the GHS built-up grid
2. CIESIN (Center for International Earth Science Information Network)
3. [Link] Klein Goldewijk, K., Beusen, A., Doelman, J., and Stehfest, E.: Anthropogenic land use estimates for the Holocene – HYDE 3.2, Earth Syst. Sci. Data, 9, 927–953, https://doi.org/10.5194/essd-9-927-2017, 2017.
Area Codes
Percentage Area Codes used by businesses in Lockport, Illinois Area Code 815: 83%
Area Code 708: 8.4%
Other: 8.6%
Business distribution by price for Lockport, Illinois
Inexpensive: 49.8%
Moderate: 41.5%
Expensive: 7.2%
Very Expensive: 1.4%
Human Development Index (HDI)
Statistic composite index of life expectancy, education, and per capita income.Sources: [Link] Kummu, M., Taka, M. & Guillaume, J. Gridded global datasets for Gross Domestic Product and Human Development Index over 1990–2015. Sci Data 5, 180004 (2018) doi:10.1038/sdata.2018.4
Lockport, Illinois CO2 Emissions
Carbon Dioxide (CO2) Emissions Per Capita in Tonnes Per Year| Location | CO2 Emissions | CO2 Emissions Per Capita | CO2 Emissions Intensity |
|---|---|---|---|
| Lockport, Illinois | 515,261 tn | 18.1 tn | 45,447 tons/mi² |
| Illinois | 259,471,378 tn | 20 tn | 4,480 tons/mi² |
| United States | 5,664,619,809 tn | 17.6 tn | 1,491 tons/mi² |
Lockport, Illinois CO2 Emissions
| 2013 CO2 emissions (tonnes/year) | 515,261 tn |
| 2013 CO2 emissions (tonnes/year) per capita | 18.1 tn |
| 2013 CO2 emissions intensity (tonnes/mi²/year) |
Natural Hazards Risk
Relative risk out of 10| Flood | High (8) |
* Risk, particularly concerning flood or landslide, may not be for the entire area.
Sources: 1. Dilley, M., R.S. Chen, U. Deichmann, A.L. Lerner-Lam, M. Arnold, J. Agwe, P. Buys, O. Kjekstad, B. Lyon, and G. Yetman. 2005. Natural Disaster Hotspots: A Global Risk Analysis. Washington, D.C.: World Bank. https://doi.org/10.1596/0-8213-5930-4.
2. Center for Hazards and Risk Research - CHRR - Columbia University, Center for International Earth Science Information Network - CIESIN - Columbia University. 2005. Global Flood Hazard Frequency and Distribution. Palisades, NY: NASA Socioeconomic Data and Applications Center (SEDAC). https://doi.org/10.7927/H4668B3D.
Recent Nearby Earthquakes
Magnitude 3.0 and greater| Date | Time | Magnitude | Distance | Depth | Location | Link |
|---|---|---|---|---|---|---|
| 11/4/13 | 10:35 AM | 3.2 | 30.4 km | 1,000 m | 1km NW of Summit, Illinois | usgs.gov |
| 2/10/10 | 1:59 AM | 3.8 | 55.8 km | 10,000 m | 8km NW of Village of Campton Hills, Illinois | usgs.gov |
| 6/27/04 | 11:10 PM | 4.2 | 71.7 km | 10,000 m | 10km NW of Ottawa, Illinois | usgs.gov |
| 1/2/12 | 8:21 AM | 4.5 | 38.2 km | None | Illinois | usgs.gov |
| 5/26/09 | 6:42 AM | 5.1 | 3.7 km | None | Illinois | usgs.gov |
| 5/26/81 | 4:07 PM | 4.6 | 92.8 km | None | Illinois | usgs.gov |
| 8/20/04 | 12:17 PM | 4.4 | 50.4 km | None | Illinois | usgs.gov |

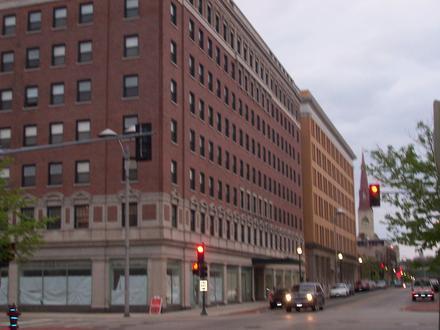
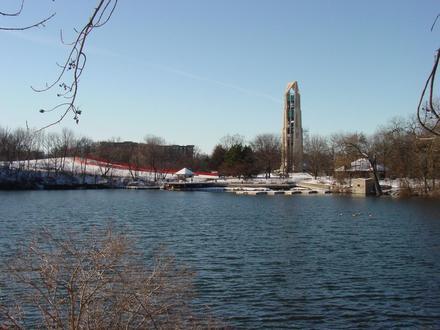
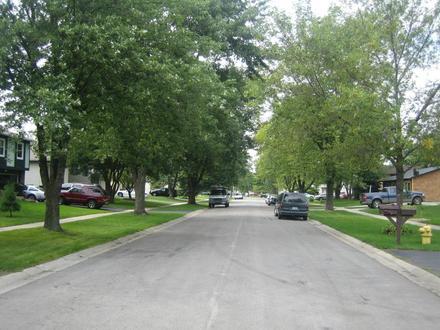
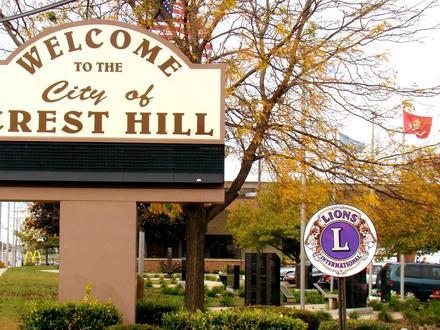
Lockport, Illinois
Lockport is a historic city in Will County, Illinois, United States, located 30 miles southwest of Chicago. Lockport was listed on the National Register of Historic Places on May 12, 1975. The city was incorporated in 1853 and is situated along the I.. Lockport, Illinois Wikipedia Page
About Our Data
The data on this page is estimated using a number of publicly available tools and resources. It is provided without warranty, and could contain inaccuracies. Use at your own risk. See here for more information.