Businesses in Luthersville, Georgia
Hotels & Travel
Restaurants
Automotive
Financial Services
Medical
Beauty & Spas
Community & Government
Industries
Business Distribution by Industry Shopping: 14%
Industry: 13.6%
Professional Services: 10.7%
Religion: 9.5%
Automotive: 9.1%
Home Services: 7.9%
Food: 7%
Local Services: 5%
Other: 23.1%
| Industry Description | Number of Establishments | Average Age of Business | Average Google Rating | Businesses per 1,000 residents |
|---|---|---|---|---|
| Car repair | 7 | 26.8 years | 4.4 | 8.2 |
| Gas stations | 9 | 32.9 years | 3.9 | 10.5 |
| Convenience stores | 7 | 24.5 years | 3.6 | 8.2 |
| Grocery stores and supermarkets | 6 | 30.1 years | 4.1 | 7.0 |
| General contractors | 6 | 28.8 years | 5.0 | 7.0 |
| Construction of buildings | 7 | 35.2 years | 4.4 | 8.2 |
| Churches | 9 | 66.4 years | 4.3 | 10.5 |
| Shopping other | 5 | 24.5 years | 3.9 | 5.8 |
| Area of Luthersville, Georgia | 3.089 sq mi |
| Population | 855 |
| Male Population | 415 (48.5%) |
| Female Population | 440 (51.5%) |
| Population change from 1975 to 2015 | +168% |
| Population change from 2000 to 2015 | -5.1% |
| Median Age | 31.3 |
| Male Median Age | 28.3 |
| Female Median Age | 34.1 |
| Area Codes | 678, 770 |
| Local Time | Thursday 8:59 PM |
| Timezone | Eastern Daylight Time |
| Lat & Lng | 33.21012° / -84.74438° |
| Zip Codes | 30251 |
Luthersville, Georgia - Map
Luthersville, Georgia Population
Years 1975 to 2015| Data | 1975 | 1990 | 2000 | 2015 |
|---|---|---|---|---|
| Population | 319 | 582 | 901 | 855 |
| Population Density | 103.3 / mi² | 188.4 / mi² | 291.7 / mi² | 276.8 / mi² |
Luthersville, Georgia Population change from 2000 to 2015
Decrease of 5.1% from year 2000 to 2015| Location | Change since 1975 | Change since 1990 | Change since 2000 |
|---|---|---|---|
| Luthersville, Georgia | +168% | +46.9% | -5.1% |
| Georgia | +93.8% | +53.1% | +27.8% |
| United States | +46.9% | +27.2% | +13.7% |
Luthersville, Georgia Median Age
Median Age: 31.3 years| Location | Median Age | Median Age (Female) | Median Age (Male) |
|---|---|---|---|
| Luthersville, Georgia | 31.3 years | 34.1 years | 28.3 years |
| Georgia | 35.4 years | 36.6 years | 34.2 years |
| United States | 37.4 years | 38.7 years | 36.1 years |
Luthersville, Georgia Population Tree
Population By Age and Gender| Age | Male | Female | Total |
|---|---|---|---|
| Under 5 | 42 | 39 | 82 |
| 5-9 | 28 | 41 | 69 |
| 10-14 | 45 | 24 | 69 |
| 15-19 | 36 | 30 | 66 |
| 20-24 | 36 | 24 | 61 |
| 25-29 | 30 | 43 | 73 |
| 30-34 | 27 | 24 | 51 |
| 35-39 | 26 | 26 | 52 |
| 40-44 | 24 | 25 | 49 |
| 45-49 | 33 | 36 | 69 |
| 50-54 | 22 | 33 | 56 |
| 55-59 | 19 | 28 | 47 |
| 60-64 | 14 | 20 | 35 |
| 65-69 | 11 | 16 | 28 |
| 70-74 | 10 | 14 | 25 |
| 75-79 | 6 | 9 | 15 |
| 80-84 | 2 | 5 | 8 |
| 85 Plus | 4 | 4 | 8 |
Luthersville, Georgia Population Density
Population Density: 276.8 / mi²| Location | Population | Area | Population Density |
|---|---|---|---|
| Luthersville, Georgia | 855 | 3.089 sq mi | 276.8 / mi² |
| Georgia | 10.5 million | 59,425.5 sq mi | 176.8 / mi² |
| United States | 321.6 million | 3,796,761.2 sq mi | 84.7 / mi² |
Luthersville, Georgia Historical Population
Estimated Population from 1800 to 2015Sources:
1. JRC (European Commission's Joint Research Centre) work on the GHS built-up grid
2. CIESIN (Center for International Earth Science Information Network)
3. [Link] Klein Goldewijk, K., Beusen, A., Doelman, J., and Stehfest, E.: Anthropogenic land use estimates for the Holocene – HYDE 3.2, Earth Syst. Sci. Data, 9, 927–953, https://doi.org/10.5194/essd-9-927-2017, 2017.
Area Codes
Percentage Area Codes used by businesses in Luthersville, Georgia Area Code 770: 83.7%
Area Code 678: 11.6%
Other: 4.7%
Business distribution by price for Luthersville, Georgia
Inexpensive: 62.5%
Moderate: 25%
Expensive: 12.5%
Human Development Index (HDI)
Statistic composite index of life expectancy, education, and per capita income.Sources: [Link] Kummu, M., Taka, M. & Guillaume, J. Gridded global datasets for Gross Domestic Product and Human Development Index over 1990–2015. Sci Data 5, 180004 (2018) doi:10.1038/sdata.2018.4
Luthersville, Georgia CO2 Emissions
Carbon Dioxide (CO2) Emissions Per Capita in Tonnes Per Year| Location | CO2 Emissions | CO2 Emissions Per Capita | CO2 Emissions Intensity |
|---|---|---|---|
| Luthersville, Georgia | 14,150 tn | 16.5 tn | 4,581 tons/mi² |
| Georgia | 183,571,844 tn | 17.5 tn | 3,089 tons/mi² |
| United States | 5,664,619,809 tn | 17.6 tn | 1,491 tons/mi² |
Luthersville, Georgia CO2 Emissions
| 2013 CO2 emissions (tonnes/year) | 14,150 tn |
| 2013 CO2 emissions (tonnes/year) per capita | 16.5 tn |
| 2013 CO2 emissions intensity (tonnes/mi²/year) |
Natural Hazards Risk
Relative risk out of 10| Flood | Medium (4) |
* Risk, particularly concerning flood or landslide, may not be for the entire area.
Sources: 1. Dilley, M., R.S. Chen, U. Deichmann, A.L. Lerner-Lam, M. Arnold, J. Agwe, P. Buys, O. Kjekstad, B. Lyon, and G. Yetman. 2005. Natural Disaster Hotspots: A Global Risk Analysis. Washington, D.C.: World Bank. https://doi.org/10.1596/0-8213-5930-4.
2. Center for Hazards and Risk Research - CHRR - Columbia University, Center for International Earth Science Information Network - CIESIN - Columbia University. 2005. Global Flood Hazard Frequency and Distribution. Palisades, NY: NASA Socioeconomic Data and Applications Center (SEDAC). https://doi.org/10.7927/H4668B3D.
Recent Nearby Earthquakes
Magnitude 3.0 and greater| Date | Time | Magnitude | Distance | Depth | Location | Link |
|---|---|---|---|---|---|---|
| 10/30/82 | 8:12 PM | 3.1 | 62.6 km | 5,000 m | Georgia, USA | usgs.gov |

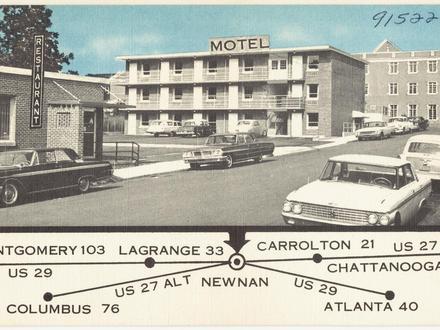
Luthersville, Georgia
Luthersville is a city in Meriwether County, Georgia, United States. The population was 783 at the 2000 census. Luthersville, Georgia Wikipedia Page
About Our Data
The data on this page is estimated using a number of publicly available tools and resources. It is provided without warranty, and could contain inaccuracies. Use at your own risk. See here for more information.