- World
- »
- US
- »
- Nevada
- »
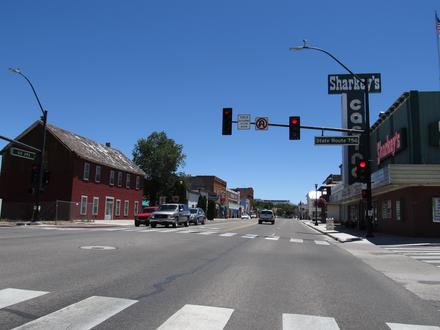
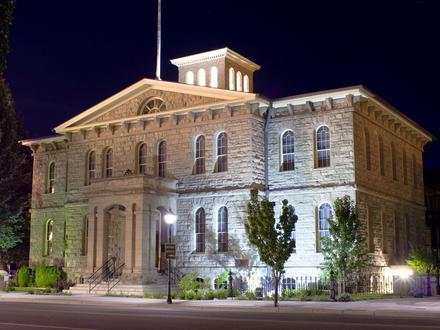
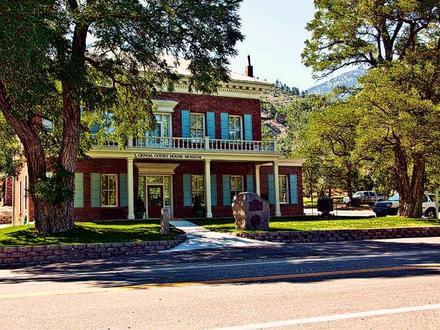
- Minden, Nevada
Businesses in Minden, Nevada
Hotels & Travel
Restaurants
Automotive
Financial Services
Medical
Beauty & Spas
Community & Government
Industries
Business Distribution by Industry Professional Services: 16.1%
Shopping: 14.9%
Industry: 11.7%
Medical: 10.7%
Home Services: 9.5%
Other: 37%
| Industry Description | Number of Establishments | Average Age of Business | Average Google Rating | Businesses per 1,000 residents |
|---|---|---|---|---|
| Car repair | 23 | 27.6 years | 4.7 | 7.1 |
| Gas stations | 13 | 34.9 years | 4.2 | 4.0 |
| Beauty salons | 25 | 20.1 years | 4.3 | 7.8 |
| Hairdressers | 20 | 22.3 years | 4.4 | 6.2 |
| Public administration | 35 | 52.9 years | 4.4 | 10.9 |
| Social work | 13 | 30.2 years | 1.5 | 4.0 |
| Finance other | 14 | 63.4 years | 3.7 | 4.3 |
| Loan companies | 31 | 51.3 years | 4.3 | 9.6 |
| Grocery stores and supermarkets | 17 | 21.7 years | 4.1 | 5.3 |
| Electrical installation | 13 | 32.1 years | 4.3 | 4.0 |
| General contractors | 66 | 29 years | 4.2 | 20.5 |
| Other construction | 29 | 28.4 years | 4.3 | 9.0 |
| Real estate | 70 | 35 years | 4.0 | 21.7 |
| Construction of buildings | 48 | 29.1 years | 3.8 | 14.9 |
| Wholesale of machinery | 26 | 32 years | 3.5 | 8.1 |
| Photography | 13 | 25.2 years | 4.4 | 4.0 |
| Dentists | 31 | 28.2 years | 4.9 | 9.6 |
| Health and medical | 145 | 26.9 years | 4.2 | 45.0 |
| Physicians and surgeons | 34 | 30 years | 3.2 | 10.5 |
| Accountants | 15 | 45.8 years | 4.6 | 4.7 |
| Advertising and marketing | 13 | 27.9 years | 4.0 | |
| Corporate management | 44 | 25.1 years | 4.8 | 13.6 |
| Lawyers legal | 28 | 25 years | 4.4 | 8.7 |
| Scientific and technical services | 24 | 23.6 years | 3.0 | 7.4 |
| Specialized design | 17 | 26.9 years | 4.8 | 5.3 |
| Technical construction services | 27 | 30.3 years | 4.9 | 8.4 |
| Electronics stores | 24 | 25.4 years | 4.5 | 7.4 |
| Hardware stores | 13 | 30.8 years | 4.7 | 4.0 |
| Shopping other | 16 | 32.3 years | 4.2 | 5.0 |
| Area of Minden, Nevada | 4.286 sq mi |
| Population | 3,224 |
| Male Population | 1,568 (48.6%) |
| Female Population | 1,656 (51.4%) |
| Population change from 1975 to 2015 | +118.9% |
| Population change from 2000 to 2015 | +20.1% |
| Median Age | 49.8 |
| Male Median Age | 48.2 |
| Female Median Age | 51.4 |
| Area Codes | 775 |
| Neighborhoods | Minden, South Meadows |
| Local Time | Wednesday 8:33 PM |
| Timezone | Pacific Daylight Time |
| Facebook Profile | |
| Lat & Lng | 38.95407° / -119.76573° |
| Zip Codes | 89423 |
Minden, Nevada - Map
Minden, Nevada Population
Years 1975 to 2015| Data | 1975 | 1990 | 2000 | 2015 |
|---|---|---|---|---|
| Population | 1,473 | 1,700 | 2,685 | 3,224 |
| Population Density | 343.7 / mi² | 396.7 / mi² | 626.5 / mi² | 752.3 / mi² |
Minden, Nevada Population change from 2000 to 2015
Increase of 20.1% from year 2000 to 2015| Location | Change since 1975 | Change since 1990 | Change since 2000 |
|---|---|---|---|
| Minden, Nevada | +118.9% | +89.6% | +20.1% |
| Nevada | +240.2% | +114.5% | +55.2% |
| United States | +46.9% | +27.2% | +13.7% |
Minden, Nevada Median Age
Median Age: 49.8 years| Location | Median Age | Median Age (Female) | Median Age (Male) |
|---|---|---|---|
| Minden, Nevada | 49.8 years | 51.4 years | 48.2 years |
| Nevada | 36.3 years | 36.9 years | 35.8 years |
| United States | 37.4 years | 38.7 years | 36.1 years |
Minden, Nevada Population Tree
Population By Age and Gender| Age | Male | Female | Total |
|---|---|---|---|
| Under 5 | 66 | 47 | 113 |
| 5-9 | 76 | 65 | 141 |
| 10-14 | 94 | 79 | 173 |
| 15-19 | 108 | 88 | 197 |
| 20-24 | 79 | 45 | 125 |
| 25-29 | 70 | 87 | 157 |
| 30-34 | 74 | 64 | 138 |
| 35-39 | 62 | 79 | 142 |
| 40-44 | 77 | 97 | 175 |
| 45-49 | 123 | 136 | 260 |
| 50-54 | 104 | 147 | 252 |
| 55-59 | 117 | 142 | 259 |
| 60-64 | 127 | 139 | 266 |
| 65-69 | 104 | 116 | 221 |
| 70-74 | 90 | 106 | 197 |
| 75-79 | 88 | 76 | 164 |
| 80-84 | 59 | 76 | 136 |
| 85 Plus | 50 | 68 | 119 |
Minden, Nevada Population Density
Population Density: 752.3 / mi²| Location | Population | Area | Population Density |
|---|---|---|---|
| Minden, Nevada | 3,224 | 4.286 sq mi | 752.3 / mi² |
| Nevada | 3.1 million | 110,572.6 sq mi | 28.2 / mi² |
| United States | 321.6 million | 3,796,761.2 sq mi | 84.7 / mi² |
Minden, Nevada Historical and Projected Population
Estimated Population from 1870 to 2100Sources:
1. JRC (European Commission's Joint Research Centre) work on the GHS built-up grid
2. CIESIN (Center for International Earth Science Information Network)
3. [Link] Klein Goldewijk, K., Beusen, A., Doelman, J., and Stehfest, E.: Anthropogenic land use estimates for the Holocene – HYDE 3.2, Earth Syst. Sci. Data, 9, 927–953, https://doi.org/10.5194/essd-9-927-2017, 2017.
Business distribution by price for Minden, Nevada
Moderate: 51.4%
Inexpensive: 29.5%
Expensive: 14.3%
Very Expensive: 4.8%
Human Development Index (HDI)
Statistic composite index of life expectancy, education, and per capita income.Sources: [Link] Kummu, M., Taka, M. & Guillaume, J. Gridded global datasets for Gross Domestic Product and Human Development Index over 1990–2015. Sci Data 5, 180004 (2018) doi:10.1038/sdata.2018.4
Minden, Nevada CO2 Emissions
Carbon Dioxide (CO2) Emissions Per Capita in Tonnes Per Year| Location | CO2 Emissions | CO2 Emissions Per Capita | CO2 Emissions Intensity |
|---|---|---|---|
| Minden, Nevada | 62,033 tn | 19.2 tn | 14,474 tons/mi² |
| Nevada | 55,621,449 tn | 17.8 tn | 503 tons/mi² |
| United States | 5,664,619,809 tn | 17.6 tn | 1,491 tons/mi² |
Minden, Nevada CO2 Emissions
| 2013 CO2 emissions (tonnes/year) | 62,033 tn |
| 2013 CO2 emissions (tonnes/year) per capita | 19.2 tn |
| 2013 CO2 emissions intensity (tonnes/mi²/year) |
Natural Hazards Risk
Relative risk out of 10| Drought | High (9) |
| Earthquake | High (8.5) |
* Risk, particularly concerning flood or landslide, may not be for the entire area.
Sources: 1. Dilley, M., R.S. Chen, U. Deichmann, A.L. Lerner-Lam, M. Arnold, J. Agwe, P. Buys, O. Kjekstad, B. Lyon, and G. Yetman. 2005. Natural Disaster Hotspots: A Global Risk Analysis. Washington, D.C.: World Bank. https://doi.org/10.1596/0-8213-5930-4.
2. Center for Hazards and Risk Research - CHRR - Columbia University, Center for International Earth Science Information Network - CIESIN - Columbia University, and International Research Institute for Climate and Society - IRI - Columbia University. 2005. Global Drought Hazard Frequency and Distribution. Palisades, NY: NASA Socioeconomic Data and Applications Center (SEDAC). https://doi.org/10.7927/H4VX0DFT.
3. Center for Hazards and Risk Research - CHRR - Columbia University, Center for International Earth Science Information Network - CIESIN - Columbia University. 2005. Global Earthquake Hazard Distribution - Peak Ground Acceleration. Palisades, NY: NASA Socioeconomic Data and Applications Center (SEDAC). https://doi.org/10.7927/H4BZ63ZS.
Recent Nearby Earthquakes
Magnitude 3.0 and greater| Date | Time | Magnitude | Distance | Depth | Location | Link |
|---|---|---|---|---|---|---|
| 12/20/18 | 5:30 AM | 3.2 | 18 km | 7,900 m | 5km ENE of Indian Hills, Nevada | usgs.gov |
| 12/20/18 | 5:24 AM | 3.6 | 17.9 km | 8,100 m | 5km ENE of Indian Hills, Nevada | usgs.gov |
| 12/4/18 | 7:14 AM | 3.2 | 18.2 km | 8,400 m | 5km NE of Indian Hills, Nevada | usgs.gov |
| 1/1/11 | 3:57 PM | 3.53 | 13.7 km | -444 m | 7km SW of Gardnerville Ranchos, Nevada | usgs.gov |
| 1/12/08 | 3:51 AM | 3.3 | 16.6 km | 7,400 m | Nevada | usgs.gov |
| 3/24/97 | 11:54 AM | 3.3 | 16 km | 2,629 m | 10km ESE of Gardnerville Ranchos, Nevada | usgs.gov |
| 10/16/95 | 2:06 PM | 3.5 | 17.6 km | 3,629 m | 10km SSE of Gardnerville Ranchos, Nevada | usgs.gov |
| 6/17/95 | 6:19 AM | 3.1 | 13.5 km | 1,881 m | 6km S of Gardnerville Ranchos, Nevada | usgs.gov |
| 5/26/95 | 10:49 PM | 3.9 | 18.4 km | -1,181 m | Northern California | usgs.gov |
| 11/14/94 | 6:00 AM | 3.24 | 18.8 km | 11,250 m | Northern California | usgs.gov |
Find historical earthquake occurrences near Minden, Nevada
Earliest Date Latest Date
Magnitude 3.0 and greater Magnitude 4.0 and greater Magnitude 5.0 and greater

Minden, Nevada
Minden is a census-designated place (CDP) in Douglas County, Nevada, United States. The population was 3,001 at the 2010 census. It is the county seat of Douglas County and is adjacent to the city of Gardnerville. It was founded in 1906 by Heinrich F.. Minden, Nevada Wikipedia Page
About Our Data
The data on this page is estimated using a number of publicly available tools and resources. It is provided without warranty, and could contain inaccuracies. Use at your own risk. See here for more information.