Businesses in Mountain Lake, Minnesota
Industries
Business Distribution by Industry Industry: 18.4%
Shopping: 17.3%
Home Services: 8.1%
Medical: 6.5%
Food: 6.2%
Religion: 5.7%
Education: 5.7%
Financial Services: 5.7%
Professional Services: 5.1%
Other: 21.1%
| Industry Description | Number of Establishments | Average Age of Business | Average Google Rating | Businesses per 1,000 residents |
|---|---|---|---|---|
| Grocery stores and supermarkets | 10 | 39.3 years | 4.5 | 5.0 |
| General contractors | 12 | 28.7 years | 3.8 | 6.0 |
| Other membership organizations | 8 | 36.5 years | 4.2 | 4.0 |
| Tractors and farm equipment | 8 | 26.5 years | 4.2 | 4.0 |
| Churches | 10 | 106 years | 4.5 | 5.0 |
| Area of Mountain Lake, Minnesota | 1.548 sq mi |
| Population | 2,010 |
| Male Population | 973 (48.4%) |
| Female Population | 1,037 (51.6%) |
| Population change from 1975 to 2015 | +87% |
| Population change from 2000 to 2015 | -7.5% |
| Median Age | 39.3 |
| Male Median Age | 35.8 |
| Female Median Age | 42.5 |
| Area Codes | 507 |
| Local Time | Thursday 9:59 PM |
| Timezone | Central Daylight Time |
| Lat & Lng | 43.93885° / -94.92971° |
| Zip Codes | 56159 |
Mountain Lake, Minnesota - Map
Mountain Lake, Minnesota Population
Years 1975 to 2015| Data | 1975 | 1990 | 2000 | 2015 |
|---|---|---|---|---|
| Population | 1,075 | 1,656 | 2,173 | 2,010 |
| Population Density | 694.3 / mi² | 1,069 / mi² | 1,403 / mi² | 1,298 / mi² |
Mountain Lake, Minnesota Population change from 2000 to 2015
Decrease of 7.5% from year 2000 to 2015| Location | Change since 1975 | Change since 1990 | Change since 2000 |
|---|---|---|---|
| Mountain Lake, Minnesota | +87% | +21.4% | -7.5% |
| Minnesota | +38.9% | +22.1% | +10.6% |
| United States | +46.9% | +27.2% | +13.7% |
Mountain Lake, Minnesota Median Age
Median Age: 39.3 years| Location | Median Age | Median Age (Female) | Median Age (Male) |
|---|---|---|---|
| Mountain Lake, Minnesota | 39.3 years | 42.5 years | 35.8 years |
| Minnesota | 38.1 years | 39.1 years | 37 years |
| United States | 37.4 years | 38.7 years | 36.1 years |
Mountain Lake, Minnesota Population Tree
Population By Age and Gender| Age | Male | Female | Total |
|---|---|---|---|
| Under 5 | 67 | 75 | 143 |
| 5-9 | 78 | 76 | 155 |
| 10-14 | 86 | 70 | 157 |
| 15-19 | 72 | 64 | 137 |
| 20-24 | 62 | 53 | 116 |
| 25-29 | 45 | 47 | 93 |
| 30-34 | 68 | 58 | 126 |
| 35-39 | 40 | 46 | 86 |
| 40-44 | 50 | 58 | 109 |
| 45-49 | 64 | 64 | 128 |
| 50-54 | 69 | 62 | 132 |
| 55-59 | 62 | 53 | 115 |
| 60-64 | 39 | 47 | 87 |
| 65-69 | 32 | 29 | 61 |
| 70-74 | 24 | 44 | 69 |
| 75-79 | 31 | 44 | 75 |
| 80-84 | 36 | 55 | 92 |
| 85 Plus | 47 | 91 | 139 |
Mountain Lake, Minnesota Population Density
Population Density: 1,298 / mi²| Location | Population | Area | Population Density |
|---|---|---|---|
| Mountain Lake, Minnesota | 2,010 | 1.548 sq mi | 1,298 / mi² |
| Minnesota | 5.5 million | 86,935.8 sq mi | 63.0 / mi² |
| United States | 321.6 million | 3,796,761.2 sq mi | 84.7 / mi² |
Business distribution by price for Mountain Lake, Minnesota
Inexpensive: 46.2%
Moderate: 38.5%
Expensive: 15.4%
Human Development Index (HDI)
Statistic composite index of life expectancy, education, and per capita income.Sources: [Link] Kummu, M., Taka, M. & Guillaume, J. Gridded global datasets for Gross Domestic Product and Human Development Index over 1990–2015. Sci Data 5, 180004 (2018) doi:10.1038/sdata.2018.4
Mountain Lake, Minnesota CO2 Emissions
Carbon Dioxide (CO2) Emissions Per Capita in Tonnes Per Year| Location | CO2 Emissions | CO2 Emissions Per Capita | CO2 Emissions Intensity |
|---|---|---|---|
| Mountain Lake, Minnesota | 34,115 tn | 17 tn | 22,034 tons/mi² |
| Minnesota | 113,067,387 tn | 20.7 tn | 1,300 tons/mi² |
| United States | 5,664,619,809 tn | 17.6 tn | 1,491 tons/mi² |
Mountain Lake, Minnesota CO2 Emissions
| 2013 CO2 emissions (tonnes/year) | 34,115 tn |
| 2013 CO2 emissions (tonnes/year) per capita | 17 tn |
| 2013 CO2 emissions intensity (tonnes/mi²/year) |
Natural Hazards Risk
Relative risk out of 10| Flood | High (7) |
* Risk, particularly concerning flood or landslide, may not be for the entire area.
Sources: 1. Dilley, M., R.S. Chen, U. Deichmann, A.L. Lerner-Lam, M. Arnold, J. Agwe, P. Buys, O. Kjekstad, B. Lyon, and G. Yetman. 2005. Natural Disaster Hotspots: A Global Risk Analysis. Washington, D.C.: World Bank. https://doi.org/10.1596/0-8213-5930-4.
2. Center for Hazards and Risk Research - CHRR - Columbia University, Center for International Earth Science Information Network - CIESIN - Columbia University. 2005. Global Flood Hazard Frequency and Distribution. Palisades, NY: NASA Socioeconomic Data and Applications Center (SEDAC). https://doi.org/10.7927/H4668B3D.
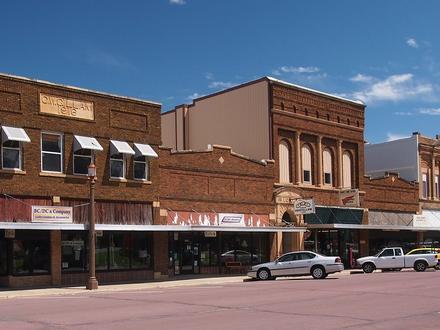
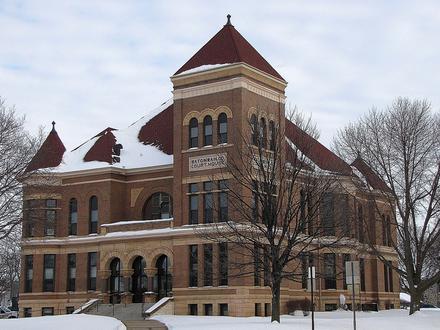
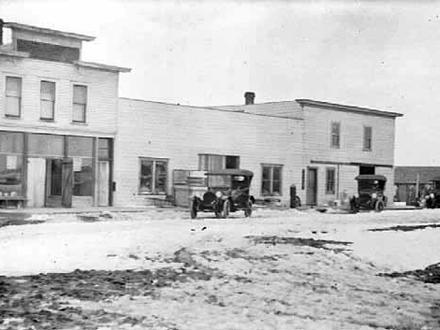
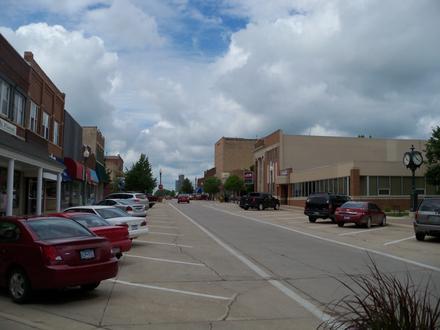
Mountain Lake, Minnesota
Mountain Lake is a city in Cottonwood County, Minnesota, United States. The population was 2,104 at the 2010 census. Lake was initially composed mostly of the 1,800 Low German (or more specifically, Plautdietsch) speaking Mennonites from Russia who .. Mountain Lake, Minnesota Wikipedia Page
About Our Data
The data on this page is estimated using a number of publicly available tools and resources. It is provided without warranty, and could contain inaccuracies. Use at your own risk. See here for more information.