- World
- »
- US
- »
- Maryland
- »
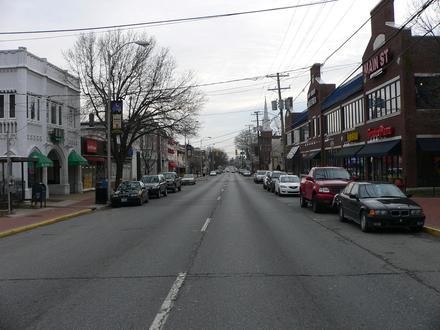
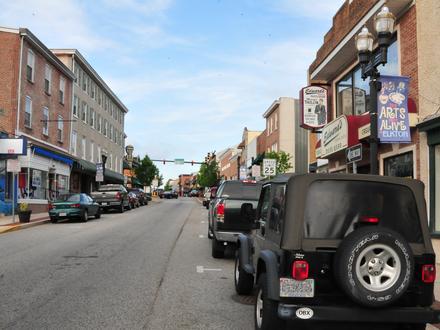
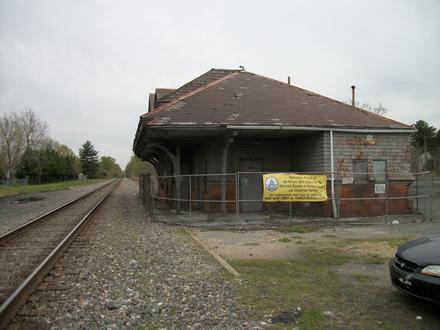
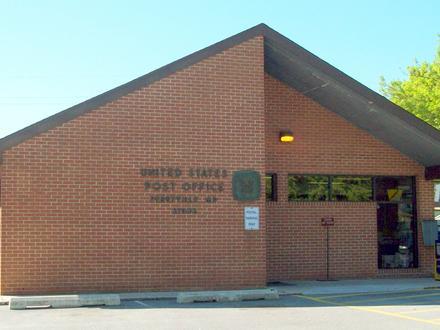
- North East, Maryland
Businesses in North East
Hotels & Travel
Restaurants
Automotive
Financial Services
Medical
Beauty & Spas
Community & Government
Industries
Business Distribution by Industry Shopping: 19%
Home Services: 12%
Professional Services: 10.4%
Industry: 9.1%
Restaurants: 6.4%
Automotive: 5.3%
Medical: 5.1%
Local Services: 5%
Other: 27.6%
| Industry Description | Number of Establishments | Average Age of Business | Average Google Rating | Businesses per 1,000 residents |
|---|---|---|---|---|
| Boats | 11 | 45 years | 4.3 | 2.9 |
| Car parts | 13 | 44.6 years | 4.1 | 3.4 |
| Car repair | 17 | 39.7 years | 4.1 | 4.5 |
| Gas stations | 15 | 24.4 years | 3.9 | 3.9 |
| Beauty salons | 18 | 26.7 years | 4.2 | 4.7 |
| Hairdressers | 19 | 27.2 years | 4.2 | 5.0 |
| Social work | 9 | 43 years | 4.1 | 2.4 |
| Atm's | 11 | 3.0 | 2.9 | |
| Banks | 12 | 3.0 | 3.2 | |
| Finance other | 12 | 38.2 years | 3.0 | 3.2 |
| Loan companies | 15 | 37.6 years | 2.5 | 3.9 |
| Convenience stores | 14 | 44.7 years | 3.9 | 3.7 |
| Grocery stores and supermarkets | 20 | 29.6 years | 3.9 | 5.3 |
| Apartments | 14 | 22.3 years | 3.3 | 3.7 |
| Electrical installation | 10 | 27.8 years | 3.4 | 2.6 |
| General contractors | 45 | 27.4 years | 3.4 | 11.8 |
| Landscaping | 11 | 28.5 years | 4.2 | 2.9 |
| Moving companies | 9 | 36.1 years | 2.9 | 2.4 |
| Other construction | 24 | 28.4 years | 4.3 | 6.3 |
| Real estate | 46 | 27.7 years | 3.4 | 12.1 |
| Other accommodation | 9 | 28.1 years | 4.1 | 2.4 |
| Construction of buildings | 24 | 28.4 years | 4.4 | 6.3 |
| Other membership organizations | 9 | 63.9 years | 4.3 | 2.4 |
| Personal services | 9 | 26.1 years | 4.5 | 2.4 |
| Health and medical | 45 | 26.8 years | 4.1 | 11.8 |
| Physicians and surgeons | 13 | 22.7 years | 3.5 | 3.4 |
| Corporate management | 20 | 27.9 years | 4.6 | 5.3 |
| Scientific and technical services | 22 | 24.1 years | 4.8 | 5.8 |
| Specialized design | 9 | 20.8 years | 4.7 | 2.4 |
| Churches | 32 | 48.1 years | 4.7 | 8.4 |
| American restaurants | 11 | 30.3 years | 4.1 | 2.9 |
| Antiques | 9 | 27.5 years | 4.6 | 2.4 |
| Clothing stores | 10 | 23.2 years | 4.8 | 2.6 |
| Electronics stores | 10 | 34.9 years | 3.9 | 2.6 |
| Gifts, cards and party supplies | 11 | 25.7 years | 4.2 | 2.9 |
| Household appliances and goods | 9 | 25.4 years | 5.0 | 2.4 |
| Shopping other | 27 | 37.1 years | 4.2 | 7.1 |
| Sporting goods | 11 | 38.8 years | 4.4 | 2.9 |
| Area of North East, Maryland | 2.114 sq mi |
| Population | 3,800 |
| Male Population | 1,791 (47.1%) |
| Female Population | 2,009 (52.9%) |
| Population change from 1975 to 2015 | +57.7% |
| Population change from 2000 to 2015 | +31.3% |
| Median Age | 31.9 |
| Male Median Age | 30.8 |
| Female Median Age | 32.8 |
| Area Codes | 410, 443 |
| Neighborhoods | North East |
| Local Time | Wednesday 11:33 PM |
| Timezone | Eastern Daylight Time |
| Lat & Lng | 39.60011° / -75.94133° |
| Zip Codes | 21901 |
North East, Maryland - Map
North East, Maryland Population
Years 1975 to 2015| Data | 1975 | 1990 | 2000 | 2015 |
|---|---|---|---|---|
| Population | 2,410 | 2,807 | 2,894 | 3,800 |
| Population Density | 1,140 / mi² | 1,327 / mi² | 1,369 / mi² | 1,797 / mi² |
North East Population change from 2000 to 2015
Increase of 31.3% from year 2000 to 2015| Location | Change since 1975 | Change since 1990 | Change since 2000 |
|---|---|---|---|
| North East, Maryland | +57.7% | +35.4% | +31.3% |
| Maryland | +47.6% | +25.8% | +12.2% |
| United States | +46.9% | +27.2% | +13.7% |
North East, Maryland Median Age
Median Age: 31.9 years| Location | Median Age | Median Age (Female) | Median Age (Male) |
|---|---|---|---|
| North East, Maryland | 31.9 years | 32.8 years | 30.8 years |
| Maryland | 38.2 years | 39.6 years | 36.8 years |
| United States | 37.4 years | 38.7 years | 36.1 years |
North East, Maryland Population Tree
Population By Age and Gender| Age | Male | Female | Total |
|---|---|---|---|
| Under 5 | 170 | 168 | 339 |
| 5-9 | 133 | 167 | 301 |
| 10-14 | 137 | 106 | 244 |
| 15-19 | 124 | 140 | 265 |
| 20-24 | 146 | 166 | 312 |
| 25-29 | 166 | 181 | 347 |
| 30-34 | 129 | 134 | 264 |
| 35-39 | 100 | 119 | 220 |
| 40-44 | 99 | 115 | 215 |
| 45-49 | 122 | 125 | 247 |
| 50-54 | 109 | 130 | 239 |
| 55-59 | 120 | 122 | 242 |
| 60-64 | 89 | 108 | 197 |
| 65-69 | 49 | 58 | 108 |
| 70-74 | 33 | 58 | 91 |
| 75-79 | 33 | 44 | 78 |
| 80-84 | 21 | 33 | 55 |
| 85 Plus | 10 | 34 | 44 |
North East, Maryland Population Density
Population Density: 1,797 / mi²| Location | Population | Area | Population Density |
|---|---|---|---|
| North East, Maryland | 3,800 | 2.114 sq mi | 1,797 / mi² |
| Maryland | 6.0 million | 12,406 sq mi | 482.5 / mi² |
| United States | 321.6 million | 3,796,761.2 sq mi | 84.7 / mi² |
North East, Maryland Historical and Projected Population
Estimated Population from 1720 to 2100Sources:
1. JRC (European Commission's Joint Research Centre) work on the GHS built-up grid
2. CIESIN (Center for International Earth Science Information Network)
3. [Link] Klein Goldewijk, K., Beusen, A., Doelman, J., and Stehfest, E.: Anthropogenic land use estimates for the Holocene – HYDE 3.2, Earth Syst. Sci. Data, 9, 927–953, https://doi.org/10.5194/essd-9-927-2017, 2017.
Area Codes
Percentage Area Codes used by businesses in North East Area Code 410: 77.8%
Area Code 443: 18.7%
Other: 3.4%
Business distribution by price for North East, Maryland
Inexpensive: 49.6%
Moderate: 46%
Very Expensive: 3.5%
Expensive: 0.9%
Human Development Index (HDI)
Statistic composite index of life expectancy, education, and per capita income.Sources: [Link] Kummu, M., Taka, M. & Guillaume, J. Gridded global datasets for Gross Domestic Product and Human Development Index over 1990–2015. Sci Data 5, 180004 (2018) doi:10.1038/sdata.2018.4
North East, Maryland CO2 Emissions
Carbon Dioxide (CO2) Emissions Per Capita in Tonnes Per Year| Location | CO2 Emissions | CO2 Emissions Per Capita | CO2 Emissions Intensity |
|---|---|---|---|
| North East, Maryland | 69,110 tn | 18.2 tn | 32,695 tons/mi² |
| Maryland | 98,007,598 tn | 16.4 tn | 7,900 tons/mi² |
| United States | 5,664,619,809 tn | 17.6 tn | 1,491 tons/mi² |
North East, Maryland CO2 Emissions
| 2013 CO2 emissions (tonnes/year) | 69,110 tn |
| 2013 CO2 emissions (tonnes/year) per capita | 18.2 tn |
| 2013 CO2 emissions intensity (tonnes/mi²/year) |
Natural Hazards Risk
Relative risk out of 10| Cyclone | Medium (5) |
| Flood | High (9) |
* Risk, particularly concerning flood or landslide, may not be for the entire area.
Sources: 1. Dilley, M., R.S. Chen, U. Deichmann, A.L. Lerner-Lam, M. Arnold, J. Agwe, P. Buys, O. Kjekstad, B. Lyon, and G. Yetman. 2005. Natural Disaster Hotspots: A Global Risk Analysis. Washington, D.C.: World Bank. https://doi.org/10.1596/0-8213-5930-4.
2. Center for Hazards and Risk Research - CHRR - Columbia University, Center for International Earth Science Information Network - CIESIN - Columbia University. 2005. Global Flood Hazard Frequency and Distribution. Palisades, NY: NASA Socioeconomic Data and Applications Center (SEDAC). https://doi.org/10.7927/H4668B3D.
3. Center for Hazards and Risk Research - CHRR - Columbia University, Center for International Earth Science Information Network - CIESIN - Columbia University, International Bank for Reconstruction and Development - The World Bank, and United Nations Environment Programme Global Resource Information Database Geneva - UNEP/GRID-Geneva. 2005. Global Cyclone Hazard Frequency and Distribution. Palisades, NY: NASA Socioeconomic Data and Applications Center (SEDAC). https://doi.org/10.7927/H4CZ353K.
Recent Nearby Earthquakes
Magnitude 3.0 and greater| Date | Time | Magnitude | Distance | Depth | Location | Link |
|---|---|---|---|---|---|---|
| 11/30/17 | 1:47 PM | 4.1 | 62.6 km | 9,870 m | 9km ENE of Dover, Delaware | usgs.gov |
| 12/26/08 | 9:04 PM | 3.37 | 69.4 km | 3,610 m | Pennsylvania | usgs.gov |
| 1/15/94 | 5:49 PM | 4.6 | 81.5 km | 5,000 m | Pennsylvania | usgs.gov |
| 1/15/94 | 4:42 PM | 4.2 | 80.9 km | 5,000 m | Pennsylvania | usgs.gov |
| 10/22/90 | 6:34 PM | 3.2 | 38.7 km | 10,000 m | New Jersey | usgs.gov |
| 4/22/84 | 5:36 PM | 4.2 | 50.3 km | 5,000 m | Pennsylvania | usgs.gov |
| 3/10/80 | 10:00 PM | 3.7 | 94.5 km | 5,000 m | Greater Philadelphia area, Pennsylvania | usgs.gov |
| 3/5/80 | 9:06 AM | 3.5 | 93.6 km | 5,000 m | Greater Philadelphia area, Pennsylvania | usgs.gov |
| 7/15/78 | 11:39 PM | 3.1 | 45.4 km | 5,000 m | Pennsylvania | usgs.gov |
| 2/28/73 | 12:21 AM | 3.8 | 44.9 km | 14,000 m | New Jersey | usgs.gov |
Find historical earthquake occurrences near North East, Maryland
Earliest Date Latest Date
Magnitude 3.0 and greater Magnitude 4.0 and greater Magnitude 5.0 and greater
About Our Data
The data on this page is estimated using a number of publicly available tools and resources. It is provided without warranty, and could contain inaccuracies. Use at your own risk. See here for more information.