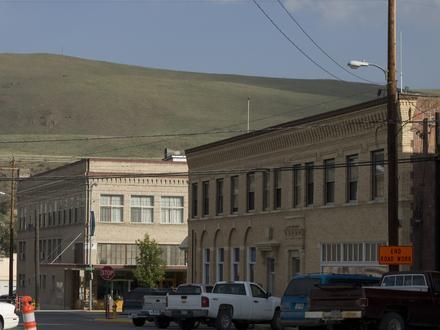
Businesses in Omak, Washington
Hotels & Travel
Restaurants
Automotive
Financial Services
Medical
Beauty & Spas
Community & Government
Industries
Business Distribution by Industry Medical: 17%
Shopping: 15.7%
Professional Services: 8.2%
Home Services: 7.9%
Industry: 6.9%
Automotive: 6.8%
Restaurants: 5.8%
Local Services: 5.4%
Other: 26.3%
| Industry Description | Number of Establishments | Average Age of Business | Average Google Rating | Businesses per 1,000 residents |
|---|---|---|---|---|
| Car parts | 9 | 39.8 years | 4.3 | 2.0 |
| Car repair | 21 | 32.8 years | 4.2 | 4.7 |
| Gas stations | 11 | 40.9 years | 4.3 | 2.5 |
| New car dealers | 9 | 27 years | 4.4 | 2.0 |
| Beauty salons | 17 | 29.8 years | 3.9 | 3.8 |
| Hairdressers | 14 | 27.9 years | 3.9 | 3.1 |
| Public administration | 23 | 34.9 years | 3.1 | 5.1 |
| Social work | 21 | 33.6 years | 4.3 | 4.7 |
| Atm's | 15 | 3.1 | 3.4 | |
| Banks | 14 | 3.4 | 3.1 | |
| Finance other | 12 | 92.1 years | 3.3 | 2.7 |
| Loan companies | 21 | 43.5 years | 4.4 | 4.7 |
| Grocery stores and supermarkets | 20 | 26.2 years | 3.9 | 4.5 |
| Apartments | 8 | 27.9 years | 4.4 | 1.8 |
| Demolition and site preparation | 8 | 35.7 years | 1.8 | |
| Electrical installation | 8 | 35.5 years | 3.8 | 1.8 |
| General contractors | 34 | 39 years | 4.1 | 7.6 |
| Other construction | 8 | 42.4 years | 4.1 | 1.8 |
| Real estate | 21 | 36.3 years | 4.0 | 4.7 |
| Hotels and motels | 9 | 61 years | 4.0 | 2.0 |
| Other accommodation | 8 | 47.7 years | 4.0 | 1.8 |
| Construction of buildings | 15 | 35.9 years | 3.9 | 3.4 |
| Personal services | 9 | 27.4 years | 3.6 | 2.0 |
| Dentists | 16 | 40.4 years | 4.4 | 3.6 |
| General practitioners | 14 | 27.3 years | 4.0 | 3.1 |
| Health and medical | 164 | 34.8 years | 4.0 | 36.7 |
| Hospitals | 8 | 35.1 years | 4.6 | 1.8 |
| Medical clinics | 10 | 41.8 years | 4.7 | 2.2 |
| Nurses | 8 | 38.9 years | 4.4 | 1.8 |
| Physicians and surgeons | 40 | 29.1 years | 3.3 | 9.0 |
| Physiotherapy | 11 | 32.2 years | 3.4 | 2.5 |
| Retirement homes | 11 | 33 years | 4.2 | 2.5 |
| Lawyers legal | 17 | 29.6 years | 3.1 | 3.8 |
| Scientific and technical services | 14 | 28.3 years | 3.0 | 3.1 |
| Technical construction services | 8 | 30.1 years | 4.0 | 1.8 |
| Churches | 14 | 53.8 years | 4.0 | 3.1 |
| Fast food restaurants | 8 | 68.4 years | 3.6 | 1.8 |
| Electronics stores | 12 | 24 years | 4.1 | 2.7 |
| Furniture stores | 8 | 30 years | 4.5 | 1.8 |
| Household appliances and goods | 8 | 33.9 years | 4.5 | 1.8 |
| Pharmacies and drug stores | 9 | 50.3 years | 3.2 | 2.0 |
| Shopping other | 16 | 33.4 years | 4.0 | 3.6 |
| Area of Omak, Washington | 3.5 sq mi |
| Population | 4,469 |
| Male Population | 2,133 (47.7%) |
| Female Population | 2,336 (52.3%) |
| Population change from 1975 to 2015 | +76% |
| Population change from 2000 to 2015 | +4.3% |
| Median Age | 38.4 |
| Male Median Age | 35.8 |
| Female Median Age | 40.8 |
| Area Codes | 509 |
| Neighborhoods | Omak |
| Local Time | Friday 8:16 AM |
| Timezone | Pacific Daylight Time |
| Lat & Lng | 48.41099° / -119.52755° |
| Zip Codes | 98841 |
Omak, Washington - Map
Omak, Washington Population
Years 1975 to 2015| Data | 1975 | 1990 | 2000 | 2015 |
|---|---|---|---|---|
| Population | 2,539 | 3,546 | 4,283 | 4,469 |
| Population Density | 725.4 / mi² | 1,013 / mi² | 1,223 / mi² | 1,276 / mi² |
Omak, Washington Population change from 2000 to 2015
Increase of 4.3% from year 2000 to 2015| Location | Change since 1975 | Change since 1990 | Change since 2000 |
|---|---|---|---|
| Omak, Washington | +76% | +26% | +4.3% |
| Washington | +78.3% | +41.1% | +20.1% |
| United States | +46.9% | +27.2% | +13.7% |
Omak, Washington Median Age
Median Age: 38.4 years| Location | Median Age | Median Age (Female) | Median Age (Male) |
|---|---|---|---|
| Omak, Washington | 38.4 years | 40.8 years | 35.8 years |
| Washington | 37.9 years | 38.9 years | 36.9 years |
| United States | 37.4 years | 38.7 years | 36.1 years |
Omak, Washington Population Tree
Population By Age and Gender| Age | Male | Female | Total |
|---|---|---|---|
| Under 5 | 186 | 178 | 365 |
| 5-9 | 158 | 145 | 303 |
| 10-14 | 143 | 143 | 286 |
| 15-19 | 131 | 139 | 271 |
| 20-24 | 131 | 138 | 270 |
| 25-29 | 169 | 148 | 317 |
| 30-34 | 129 | 136 | 265 |
| 35-39 | 118 | 122 | 240 |
| 40-44 | 106 | 122 | 228 |
| 45-49 | 136 | 143 | 280 |
| 50-54 | 147 | 175 | 323 |
| 55-59 | 137 | 144 | 282 |
| 60-64 | 130 | 148 | 278 |
| 65-69 | 110 | 118 | 228 |
| 70-74 | 70 | 92 | 163 |
| 75-79 | 62 | 81 | 144 |
| 80-84 | 32 | 83 | 116 |
| 85 Plus | 38 | 81 | 119 |
Omak, Washington Population Density
Population Density: 1,276 / mi²| Location | Population | Area | Population Density |
|---|---|---|---|
| Omak, Washington | 4,469 | 3.5 sq mi | 1,276 / mi² |
| Washington | 7.1 million | 71,298.4 sq mi | 99.7 / mi² |
| United States | 321.6 million | 3,796,761.2 sq mi | 84.7 / mi² |
Omak, Washington Historical and Projected Population
Estimated Population from 1890 to 2100Sources:
1. JRC (European Commission's Joint Research Centre) work on the GHS built-up grid
2. CIESIN (Center for International Earth Science Information Network)
3. [Link] Klein Goldewijk, K., Beusen, A., Doelman, J., and Stehfest, E.: Anthropogenic land use estimates for the Holocene – HYDE 3.2, Earth Syst. Sci. Data, 9, 927–953, https://doi.org/10.5194/essd-9-927-2017, 2017.
Business distribution by price for Omak, Washington
Moderate: 51.5%
Inexpensive: 40.9%
Expensive: 7.6%
Human Development Index (HDI)
Statistic composite index of life expectancy, education, and per capita income.Sources: [Link] Kummu, M., Taka, M. & Guillaume, J. Gridded global datasets for Gross Domestic Product and Human Development Index over 1990–2015. Sci Data 5, 180004 (2018) doi:10.1038/sdata.2018.4
Omak, Washington CO2 Emissions
Carbon Dioxide (CO2) Emissions Per Capita in Tonnes Per Year| Location | CO2 Emissions | CO2 Emissions Per Capita | CO2 Emissions Intensity |
|---|---|---|---|
| Omak, Washington | 66,470 tn | 14.9 tn | 18,991 tons/mi² |
| Washington | 122,068,940 tn | 17.2 tn | 1,712 tons/mi² |
| United States | 5,664,619,809 tn | 17.6 tn | 1,491 tons/mi² |
Omak, Washington CO2 Emissions
| 2013 CO2 emissions (tonnes/year) | 66,470 tn |
| 2013 CO2 emissions (tonnes/year) per capita | 14.9 tn |
| 2013 CO2 emissions intensity (tonnes/mi²/year) |
Natural Hazards Risk
Relative risk out of 10| Earthquake | Medium (4) |
* Risk, particularly concerning flood or landslide, may not be for the entire area.
Sources: 1. Dilley, M., R.S. Chen, U. Deichmann, A.L. Lerner-Lam, M. Arnold, J. Agwe, P. Buys, O. Kjekstad, B. Lyon, and G. Yetman. 2005. Natural Disaster Hotspots: A Global Risk Analysis. Washington, D.C.: World Bank. https://doi.org/10.1596/0-8213-5930-4.
2. Center for Hazards and Risk Research - CHRR - Columbia University, Center for International Earth Science Information Network - CIESIN - Columbia University. 2005. Global Earthquake Hazard Distribution - Peak Ground Acceleration. Palisades, NY: NASA Socioeconomic Data and Applications Center (SEDAC). https://doi.org/10.7927/H4BZ63ZS.
Recent Nearby Earthquakes
Magnitude 3.0 and greater| Date | Time | Magnitude | Distance | Depth | Location | Link |
|---|---|---|---|---|---|---|
| 7/24/17 | 12:53 PM | 3.33 | 86.9 km | 2,130 m | 7km NNE of Waterville, Washington | usgs.gov |
| 9/10/16 | 9:16 AM | 3.9 | 90.7 km | 1,000 m | 23km E of Oliver, Canada | usgs.gov |
| 9/1/15 | 9:42 AM | 4.15 | 39.4 km | 9,130 m | 38km N of Coulee Dam, Washington | usgs.gov |
| 12/30/13 | 6:59 AM | 3.2 | 30 km | 6,372 m | 29km WSW of Tonasket, Washington | usgs.gov |
| 8/7/12 | 4:59 PM | 3.22 | 98.8 km | 7,665 m | Washington | usgs.gov |
| 11/18/11 | 5:09 AM | 4.6 | 8.8 km | 11,168 m | Washington | usgs.gov |
| 7/24/06 | 11:13 PM | 3.1 | 99.9 km | 5,387 m | Washington | usgs.gov |
| 1/14/04 | 4:13 AM | 3.3 | 77.3 km | 1,207 m | Washington | usgs.gov |
| 12/26/03 | 2:07 AM | 3.4 | 38.8 km | -600 m | Washington | usgs.gov |
| 6/6/02 | 7:42 AM | 3.4 | 95.5 km | 5,847 m | Washington | usgs.gov |
Find historical earthquake occurrences near Omak, Washington
Earliest Date Latest Date
Magnitude 3.0 and greater Magnitude 4.0 and greater Magnitude 5.0 and greater

Omak, Washington
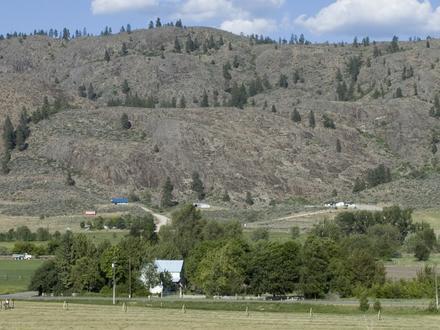
Omak (/oʊˈmæk/ o-MAK) is a city located in the foothills of the Okanogan Highlands in north-central Washington, United States. With an estimated 4,848 residents as of 2014, distributed over a land area of 3.43 square miles (8.9 km2), Omak is the larg.. Omak, Washington Wikipedia Page
About Our Data
The data on this page is estimated using a number of publicly available tools and resources. It is provided without warranty, and could contain inaccuracies. Use at your own risk. See here for more information.