- World
- »
- US
- »
- Oklahoma
- »
- Rosston, Oklahoma
Businesses in Rosston, Oklahoma
| Area of Rosston, Oklahoma | 0.309 sq mi |
| Population | 32 |
| Population change from 1975 to 2015 | +146.2% |
| Population change from 2000 to 2015 | +3.2% |
| Area Codes | 580 |
| Local Time | Thursday 4:58 AM |
| Timezone | Central Daylight Time |
| Lat & Lng | 36.81336° / -99.93402° |
| Zip Codes | 73855 |
Rosston, Oklahoma - Map
Rosston, Oklahoma Population
Years 1975 to 2015| Data | 1975 | 1990 | 2000 | 2015 |
|---|---|---|---|---|
| Population | 13 | 22 | 31 | 32 |
| Population Density | 42.1 / mi² | 71.2 / mi² | 100.4 / mi² | 103.6 / mi² |
Rosston, Oklahoma Population change from 2000 to 2015
Increase of 3.2% from year 2000 to 2015| Location | Change since 1975 | Change since 1990 | Change since 2000 |
|---|---|---|---|
| Rosston, Oklahoma | +146.2% | +45.5% | +3.2% |
| Oklahoma | +45.5% | +24.9% | +11.9% |
| United States | +46.9% | +27.2% | +13.7% |
Rosston, Oklahoma Population Density
Population Density: 103.6 / mi²| Location | Population | Area | Population Density |
|---|---|---|---|
| Rosston, Oklahoma | 32 | 0.309 sq mi | 103.6 / mi² |
| Oklahoma | 3.9 million | 69,899.3 sq mi | 55.5 / mi² |
| United States | 321.6 million | 3,796,761.2 sq mi | 84.7 / mi² |
Rosston, Oklahoma Projected Population
Estimated Population from 1975 to 2100Sources:
1. JRC (European Commission's Joint Research Centre) work on the GHS built-up grid
2. CIESIN (Center for International Earth Science Information Network)
3. [Link] Klein Goldewijk, K., Beusen, A., Doelman, J., and Stehfest, E.: Anthropogenic land use estimates for the Holocene – HYDE 3.2, Earth Syst. Sci. Data, 9, 927–953, https://doi.org/10.5194/essd-9-927-2017, 2017.
Human Development Index (HDI)
Statistic composite index of life expectancy, education, and per capita income.Sources: [Link] Kummu, M., Taka, M. & Guillaume, J. Gridded global datasets for Gross Domestic Product and Human Development Index over 1990–2015. Sci Data 5, 180004 (2018) doi:10.1038/sdata.2018.4
Rosston, Oklahoma CO2 Emissions
Carbon Dioxide (CO2) Emissions Per Capita in Tonnes Per Year| Location | CO2 Emissions | CO2 Emissions Per Capita | CO2 Emissions Intensity |
|---|---|---|---|
| Rosston, Oklahoma | 721 tn | 22.5 tn | 2,334 tons/mi² |
| Oklahoma | 77,786,423 tn | 20 tn | 1,112 tons/mi² |
| United States | 5,664,619,809 tn | 17.6 tn | 1,491 tons/mi² |
Rosston, Oklahoma CO2 Emissions
| 2013 CO2 emissions (tonnes/year) | 721 tn |
| 2013 CO2 emissions (tonnes/year) per capita | 22.5 tn |
| 2013 CO2 emissions intensity (tonnes/mi²/year) |
Recent Nearby Earthquakes
Magnitude 3.0 and greater| Date | Time | Magnitude | Distance | Depth | Location | Link |
|---|---|---|---|---|---|---|
| 2/16/18 | 7:53 AM | 3.1 | 54.6 km | 2,882 m | 28km ENE of Buffalo, Oklahoma | usgs.gov |
| 12/29/17 | 8:13 PM | 3.2 | 49.6 km | 6,216 m | 24km ESE of Buffalo, Oklahoma | usgs.gov |
| 8/15/17 | 10:13 AM | 3.1 | 55.2 km | 5,000 m | 29km ENE of Buffalo, Oklahoma | usgs.gov |
| 8/15/17 | 10:05 AM | 3.1 | 53.9 km | 5,000 m | 28km NE of Buffalo, Oklahoma | usgs.gov |
| 7/21/17 | 4:58 AM | 3.1 | 52.2 km | 7,328 m | 26km NE of Buffalo, Oklahoma | usgs.gov |
| 3/2/17 | 6:38 PM | 3.3 | 73.9 km | 5,832 m | 25km NNE of Mooreland, Oklahoma | usgs.gov |
| 3/2/17 | 12:27 PM | 3.5 | 91.3 km | 6,208 m | 22km ENE of Mooreland, Oklahoma | usgs.gov |
| 2/3/17 | 7:04 AM | 3.2 | 91.2 km | 5,982 m | 22km ENE of Mooreland, Oklahoma | usgs.gov |
| 1/11/17 | 1:34 PM | 3.1 | 90.9 km | 6,147 m | 22km ENE of Mooreland, Oklahoma | usgs.gov |
| 10/22/16 | 6:03 AM | 3.1 | 78.6 km | 4,666 m | 26km NNE of Mooreland, Oklahoma | usgs.gov |
Find historical earthquake occurrences near Rosston, Oklahoma
Earliest Date Latest Date
Magnitude 3.0 and greater Magnitude 4.0 and greater Magnitude 5.0 and greater
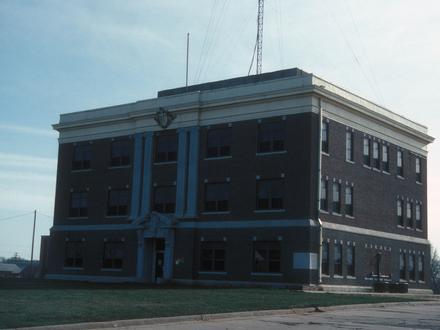
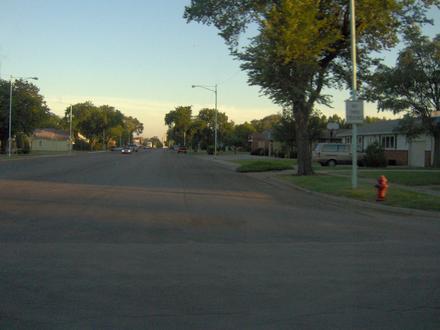
Rosston, Oklahoma
Rosston is a town in Harper County, Oklahoma, United States. The population was 31 at the 2010 census. Rosston, Oklahoma Wikipedia Page
About Our Data
The data on this page is estimated using a number of publicly available tools and resources. It is provided without warranty, and could contain inaccuracies. Use at your own risk. See here for more information.