Businesses in Snellville, Georgia
Hotels & Travel
Restaurants
Automotive
Financial Services
Medical
Beauty & Spas
Community & Government
Industries
Business Distribution by Industry Shopping: 17.4%
Medical: 16.5%
Professional Services: 13.1%
Home Services: 9.8%
Automotive: 6.5%
Industry: 6.4%
Other: 30.3%
| Industry Description | Number of Establishments | Average Age of Business | Average Google Rating | Businesses per 1,000 residents |
|---|---|---|---|---|
| Car parts | 77 | 30.1 years | 4.4 | 3.7 |
| Car repair | 165 | 27.3 years | 4.3 | 7.8 |
| Gas stations | 59 | 43.6 years | 3.7 | 2.8 |
| New car dealers | 52 | 21 years | 4.5 | 2.5 |
| Beauty salons | 133 | 22.5 years | 4.2 | 6.3 |
| Hairdressers | 118 | 25 years | 4.1 | 5.6 |
| Social work | 55 | 25 years | 4.3 | 2.6 |
| Atm's | 55 | 121.6 years | 3.6 | 2.6 |
| Finance other | 51 | 60.4 years | 4.2 | 2.4 |
| Loan companies | 107 | 36.8 years | 4.7 | 5.1 |
| General cleaning services | 78 | 17.9 years | 4.3 | 3.7 |
| General contractors | 205 | 25.9 years | 4.4 | 9.7 |
| Landscaping | 55 | 22.7 years | 4.0 | 2.6 |
| Other construction | 105 | 27.1 years | 4.5 | 5.0 |
| Real estate | 165 | 26.5 years | 4.1 | 7.8 |
| Construction of buildings | 136 | 29.1 years | 3.6 | 6.5 |
| Dentists | 96 | 29.9 years | 4.3 | 4.6 |
| Health and medical | 928 | 28.6 years | 4.0 | 44.1 |
| Physicians and surgeons | 307 | 29.7 years | 3.9 | 14.6 |
| Accountants | 83 | 29.4 years | 4.1 | 3.9 |
| Corporate management | 153 | 23.4 years | 4.1 | 7.3 |
| Lawyers legal | 84 | 27.2 years | 4.2 | 4.0 |
| Scientific and technical services | 141 | 23.6 years | 4.5 | 6.7 |
| Specialized design | 73 | 21.6 years | 4.7 | 3.5 |
| Churches | 81 | 52.3 years | 4.5 | 3.8 |
| Clothing stores | 83 | 29.7 years | 4.2 | 3.9 |
| Electronics stores | 83 | 29.3 years | 3.9 | 3.9 |
| Household appliances and goods | 52 | 30 years | 4.2 | 2.5 |
| Pharmacies and drug stores | 79 | 41.2 years | 4.1 | 3.8 |
| Shopping other | 97 | 33.3 years | 4.1 | 4.6 |
| Area of Snellville, Georgia | 9.69 sq mi |
| Population | 21,044 |
| Male Population | 9,909 (47.1%) |
| Female Population | 11,135 (52.9%) |
| Population change from 1975 to 2015 | -8.3% |
| Population change from 2000 to 2015 | +59.3% |
| Median Age | 40.6 |
| Male Median Age | 38.7 |
| Female Median Age | 42.2 |
| Area Codes | 404, 678, 770 |
| Neighborhoods | Abington Park, Dogwood Estates, Downtown, Lanier Mountain, Snellville, South Gwinnett Industrial Park, Town Estates |
| Local Time | Thursday 8:59 PM |
| Timezone | Eastern Daylight Time |
| Lat & Lng | 33.85733° / -84.01991° |
| Zip Codes | 30039, 30078 |
Snellville, Georgia - Map
Snellville, Georgia Population
Years 1975 to 2015| Data | 1975 | 1990 | 2000 | 2015 |
|---|---|---|---|---|
| Population | 22,945 | 14,051 | 13,210 | 21,044 |
| Population Density | 2,367 / mi² | 1,449 / mi² | 1,363 / mi² | 2,171 / mi² |
Snellville, Georgia Population change from 2000 to 2015
Increase of 59.3% from year 2000 to 2015| Location | Change since 1975 | Change since 1990 | Change since 2000 |
|---|---|---|---|
| Snellville, Georgia | -8.3% | +49.8% | +59.3% |
| Georgia | +93.8% | +53.1% | +27.8% |
| United States | +46.9% | +27.2% | +13.7% |
Snellville, Georgia Median Age
Median Age: 40.6 years| Location | Median Age | Median Age (Female) | Median Age (Male) |
|---|---|---|---|
| Snellville, Georgia | 40.6 years | 42.2 years | 38.7 years |
| Georgia | 35.4 years | 36.6 years | 34.2 years |
| United States | 37.4 years | 38.7 years | 36.1 years |
Snellville, Georgia Population Tree
Population By Age and Gender| Age | Male | Female | Total |
|---|---|---|---|
| Under 5 | 589 | 620 | 1,210 |
| 5-9 | 719 | 694 | 1,414 |
| 10-14 | 818 | 761 | 1,580 |
| 15-19 | 809 | 751 | 1,561 |
| 20-24 | 562 | 498 | 1,061 |
| 25-29 | 456 | 543 | 1,000 |
| 30-34 | 550 | 609 | 1,159 |
| 35-39 | 610 | 748 | 1,359 |
| 40-44 | 676 | 766 | 1,443 |
| 45-49 | 787 | 932 | 1,720 |
| 50-54 | 776 | 846 | 1,623 |
| 55-59 | 631 | 728 | 1,359 |
| 60-64 | 589 | 696 | 1,285 |
| 65-69 | 410 | 536 | 946 |
| 70-74 | 327 | 432 | 759 |
| 75-79 | 260 | 322 | 583 |
| 80-84 | 167 | 327 | 494 |
| 85 Plus | 172 | 327 | 499 |
Snellville, Georgia Population Density
Population Density: 2,171 / mi²| Location | Population | Area | Population Density |
|---|---|---|---|
| Snellville, Georgia | 21,044 | 9.69 sq mi | 2,171 / mi² |
| Georgia | 10.5 million | 59,425.5 sq mi | 176.8 / mi² |
| United States | 321.6 million | 3,796,761.2 sq mi | 84.7 / mi² |
Snellville, Georgia Projected Population
Estimated Population from 1975 to 2100Sources:
1. JRC (European Commission's Joint Research Centre) work on the GHS built-up grid
2. CIESIN (Center for International Earth Science Information Network)
3. [Link] Klein Goldewijk, K., Beusen, A., Doelman, J., and Stehfest, E.: Anthropogenic land use estimates for the Holocene – HYDE 3.2, Earth Syst. Sci. Data, 9, 927–953, https://doi.org/10.5194/essd-9-927-2017, 2017.
Neighborhoods
Business Distribution by neighborhood in Snellville, Georgia Downtown: 17.4%
Snellville: 16.9%
Town Estates: 14.9%
Lanier Mountain: 13.2%
South Gwinnett Industrial Park: 7.8%
Abington Park: 6.1%
Other: 23.7%
Area Codes
Percentage Area Codes used by businesses in Snellville, Georgia Area Code 770: 64.4%
Area Code 678: 22.2%
Area Code 404: 9.9%
Other: 3.6%
Business distribution by price for Snellville, Georgia
Moderate: 52.1%
Inexpensive: 39.7%
Expensive: 6.7%
Very Expensive: 1.5%
Human Development Index (HDI)
Statistic composite index of life expectancy, education, and per capita income.Sources: [Link] Kummu, M., Taka, M. & Guillaume, J. Gridded global datasets for Gross Domestic Product and Human Development Index over 1990–2015. Sci Data 5, 180004 (2018) doi:10.1038/sdata.2018.4
Snellville, Georgia CO2 Emissions
Carbon Dioxide (CO2) Emissions Per Capita in Tonnes Per Year| Location | CO2 Emissions | CO2 Emissions Per Capita | CO2 Emissions Intensity |
|---|---|---|---|
| Snellville, Georgia | 397,955 tn | 18.9 tn | 41,063 tons/mi² |
| Georgia | 183,571,844 tn | 17.5 tn | 3,089 tons/mi² |
| United States | 5,664,619,809 tn | 17.6 tn | 1,491 tons/mi² |
Snellville, Georgia CO2 Emissions
| 2013 CO2 emissions (tonnes/year) | 397,955 tn |
| 2013 CO2 emissions (tonnes/year) per capita | 18.9 tn |
| 2013 CO2 emissions intensity (tonnes/mi²/year) |
Natural Hazards Risk
Relative risk out of 10| Flood | High (7) |
| Earthquake | Low (2) |
* Risk, particularly concerning flood or landslide, may not be for the entire area.
Sources: 1. Dilley, M., R.S. Chen, U. Deichmann, A.L. Lerner-Lam, M. Arnold, J. Agwe, P. Buys, O. Kjekstad, B. Lyon, and G. Yetman. 2005. Natural Disaster Hotspots: A Global Risk Analysis. Washington, D.C.: World Bank. https://doi.org/10.1596/0-8213-5930-4.
2. Center for Hazards and Risk Research - CHRR - Columbia University, Center for International Earth Science Information Network - CIESIN - Columbia University. 2005. Global Flood Hazard Frequency and Distribution. Palisades, NY: NASA Socioeconomic Data and Applications Center (SEDAC). https://doi.org/10.7927/H4668B3D.
3. Center for Hazards and Risk Research - CHRR - Columbia University, Center for International Earth Science Information Network - CIESIN - Columbia University. 2005. Global Earthquake Hazard Distribution - Peak Ground Acceleration. Palisades, NY: NASA Socioeconomic Data and Applications Center (SEDAC). https://doi.org/10.7927/H4BZ63ZS.
Recent Nearby Earthquakes
Magnitude 3.0 and greater| Date | Time | Magnitude | Distance | Depth | Location | Link |
|---|---|---|---|---|---|---|
| 3/5/14 | 12:05 PM | 4.5 | 62.4 km | None | Georgia, USA | usgs.gov |

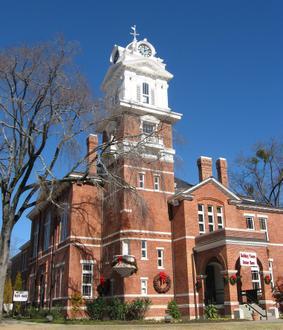
Snellville, Georgia
Snellville is an affluent city in Gwinnett County, Georgia, United States, east of Atlanta. The population was 18,242 at the 2010 census. Snellville, Georgia Wikipedia Page
Zip Codes
Percentage of businesses by Zip Codes in Snellville, Georgia Zip Code 30078: 66.3%
Zip Code 30039: 33%
Other: 0.7%

About Our Data
The data on this page is estimated using a number of publicly available tools and resources. It is provided without warranty, and could contain inaccuracies. Use at your own risk. See here for more information.