Businesses in Stevenson, Washington
Hotels & Travel
Restaurants
Automotive
Financial Services
Medical
Beauty & Spas
Community & Government
Industries
Business Distribution by Industry Shopping: 12.5%
Medical: 10.3%
Restaurants: 9.1%
Community & Government: 9.1%
Industry: 7.6%
Professional Services: 7.4%
Hotels & Travel: 6.2%
Home Services: 6.1%
Sports & Activities: 5.1%
Other: 26.6%
| Industry Description | Number of Establishments | Average Age of Business | Average Google Rating | Businesses per 1,000 residents |
|---|---|---|---|---|
| Car repair | 7 | 48.3 years | 3.3 | 4.6 |
| Gas stations | 5 | 3.4 | 3.3 | |
| Beauty salons | 5 | 4.3 | 3.3 | |
| Hairdressers | 5 | 4.5 | 3.3 | |
| Government agencies | 7 | 3.7 | 4.6 | |
| Public administration | 38 | 43 years | 3.8 | 24.8 |
| Social work | 10 | 35.5 years | 3.5 | 6.5 |
| Secondary education | 7 | 76.7 years | 3.6 | 4.6 |
| Atm's | 8 | 4.0 | 5.2 | |
| Banks | 8 | 4.0 | 5.2 | |
| General contractors | 18 | 29.5 years | 5.0 | 11.7 |
| Real estate | 8 | 44.1 years | 3.4 | 5.2 |
| Campgrounds | 5 | 4.5 | 3.3 | |
| Hotels and motels | 6 | 36.9 years | 3.9 | |
| Other accommodation | 8 | 53.3 years | 4.4 | 5.2 |
| Construction of buildings | 16 | 31.9 years | 5.0 | 10.4 |
| Other membership organizations | 6 | 4.0 | 3.9 | |
| Health and medical | 20 | 47.8 years | 3.1 | 13.1 |
| Physicians and surgeons | 9 | 3.0 | 5.9 | |
| Scientific and technical services | 6 | 3.9 | ||
| Churches | 11 | 51.3 years | 4.3 | 7.2 |
| American restaurants | 7 | 44.5 years | 4.5 | 4.6 |
| Bars, pubs and taverns | 5 | 4.5 | 3.3 | |
| Cafes | 10 | 16.8 years | 4.7 | 6.5 |
| Public parks | 8 | 4.7 | 5.2 |
| Area of Stevenson, Washington | 1.792 sq mi |
| Population | 1,532 |
| Male Population | 703 (45.9%) |
| Female Population | 829 (54.1%) |
| Population change from 1975 to 2015 | +83.7% |
| Population change from 2000 to 2015 | +16.7% |
| Median Age | 41.6 |
| Male Median Age | 39.8 |
| Female Median Age | 43.1 |
| Area Codes | 509 |
| Neighborhoods | Stevenson |
| Local Time | Friday 8:16 AM |
| Timezone | Pacific Daylight Time |
| Lat & Lng | 45.69567° / -121.88452° |
| Zip Codes | 98648 |
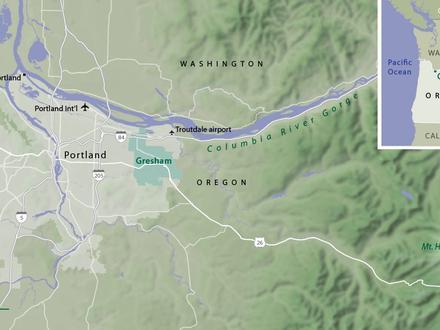
Stevenson, Washington - Map
Stevenson, Washington Population
Years 1975 to 2015| Data | 1975 | 1990 | 2000 | 2015 |
|---|---|---|---|---|
| Population | 834 | 1,094 | 1,313 | 1,532 |
| Population Density | 465.5 / mi² | 610.7 / mi² | 732.9 / mi² | 855.1 / mi² |
Stevenson, Washington Population change from 2000 to 2015
Increase of 16.7% from year 2000 to 2015| Location | Change since 1975 | Change since 1990 | Change since 2000 |
|---|---|---|---|
| Stevenson, Washington | +83.7% | +40% | +16.7% |
| Washington | +78.3% | +41.1% | +20.1% |
| United States | +46.9% | +27.2% | +13.7% |
Stevenson, Washington Median Age
Median Age: 41.6 years| Location | Median Age | Median Age (Female) | Median Age (Male) |
|---|---|---|---|
| Stevenson, Washington | 41.6 years | 43.1 years | 39.8 years |
| Washington | 37.9 years | 38.9 years | 36.9 years |
| United States | 37.4 years | 38.7 years | 36.1 years |
Stevenson, Washington Population Tree
Population By Age and Gender| Age | Male | Female | Total |
|---|---|---|---|
| Under 5 | 51 | 46 | 97 |
| 5-9 | 50 | 52 | 102 |
| 10-14 | 42 | 49 | 92 |
| 15-19 | 42 | 39 | 81 |
| 20-24 | 40 | 40 | 81 |
| 25-29 | 39 | 55 | 95 |
| 30-34 | 46 | 40 | 86 |
| 35-39 | 42 | 61 | 103 |
| 40-44 | 47 | 54 | 102 |
| 45-49 | 52 | 70 | 123 |
| 50-54 | 46 | 57 | 103 |
| 55-59 | 57 | 53 | 110 |
| 60-64 | 46 | 54 | 100 |
| 65-69 | 30 | 33 | 64 |
| 70-74 | 26 | 25 | 52 |
| 75-79 | 11 | 27 | 39 |
| 80-84 | 19 | 34 | 54 |
| 85 Plus | 17 | 39 | 56 |
Stevenson, Washington Population Density
Population Density: 855.1 / mi²| Location | Population | Area | Population Density |
|---|---|---|---|
| Stevenson, Washington | 1,532 | 1.792 sq mi | 855.1 / mi² |
| Washington | 7.1 million | 71,298.4 sq mi | 99.7 / mi² |
| United States | 321.6 million | 3,796,761.2 sq mi | 84.7 / mi² |
Stevenson, Washington Historical and Projected Population
Estimated Population from 1890 to 2100Sources:
1. JRC (European Commission's Joint Research Centre) work on the GHS built-up grid
2. CIESIN (Center for International Earth Science Information Network)
3. [Link] Klein Goldewijk, K., Beusen, A., Doelman, J., and Stehfest, E.: Anthropogenic land use estimates for the Holocene – HYDE 3.2, Earth Syst. Sci. Data, 9, 927–953, https://doi.org/10.5194/essd-9-927-2017, 2017.
Business distribution by price for Stevenson, Washington
Moderate: 56.7%
Inexpensive: 40%
Expensive: 3.3%
Human Development Index (HDI)
Statistic composite index of life expectancy, education, and per capita income.Sources: [Link] Kummu, M., Taka, M. & Guillaume, J. Gridded global datasets for Gross Domestic Product and Human Development Index over 1990–2015. Sci Data 5, 180004 (2018) doi:10.1038/sdata.2018.4
Stevenson, Washington CO2 Emissions
Carbon Dioxide (CO2) Emissions Per Capita in Tonnes Per Year| Location | CO2 Emissions | CO2 Emissions Per Capita | CO2 Emissions Intensity |
|---|---|---|---|
| Stevenson, Washington | 26,425 tn | 17.2 tn | 14,750 tons/mi² |
| Washington | 122,068,940 tn | 17.2 tn | 1,712 tons/mi² |
| United States | 5,664,619,809 tn | 17.6 tn | 1,491 tons/mi² |
Stevenson, Washington CO2 Emissions
| 2013 CO2 emissions (tonnes/year) | 26,425 tn |
| 2013 CO2 emissions (tonnes/year) per capita | 17.2 tn |
| 2013 CO2 emissions intensity (tonnes/mi²/year) |
Natural Hazards Risk
Relative risk out of 10| Landslide | Medium (6) |
| Drought | Low (2) |
| Earthquake | Medium (4) |
* Risk, particularly concerning flood or landslide, may not be for the entire area.
Sources: 1. Dilley, M., R.S. Chen, U. Deichmann, A.L. Lerner-Lam, M. Arnold, J. Agwe, P. Buys, O. Kjekstad, B. Lyon, and G. Yetman. 2005. Natural Disaster Hotspots: A Global Risk Analysis. Washington, D.C.: World Bank. https://doi.org/10.1596/0-8213-5930-4.
2. Center for Hazards and Risk Research - CHRR - Columbia University, Center for International Earth Science Information Network - CIESIN - Columbia University, and Norwegian Geotechnical Institute - NGI. 2005. Global Landslide Hazard Distribution. Palisades, NY: NASA Socioeconomic Data and Applications Center (SEDAC). https://doi.org/10.7927/H4P848VZ.
3. Center for Hazards and Risk Research - CHRR - Columbia University, Center for International Earth Science Information Network - CIESIN - Columbia University, and International Research Institute for Climate and Society - IRI - Columbia University. 2005. Global Drought Hazard Frequency and Distribution. Palisades, NY: NASA Socioeconomic Data and Applications Center (SEDAC). https://doi.org/10.7927/H4VX0DFT.
4. Center for Hazards and Risk Research - CHRR - Columbia University, Center for International Earth Science Information Network - CIESIN - Columbia University. 2005. Global Earthquake Hazard Distribution - Peak Ground Acceleration. Palisades, NY: NASA Socioeconomic Data and Applications Center (SEDAC). https://doi.org/10.7927/H4BZ63ZS.
Recent Nearby Earthquakes
Magnitude 3.0 and greater| Date | Time | Magnitude | Distance | Depth | Location | Link |
|---|---|---|---|---|---|---|
| 1/30/13 | 5:03 PM | 3.66 | 47.7 km | 6,447 m | 3km ENE of Amboy, Washington | usgs.gov |
| 7/7/03 | 5:40 AM | 3.3 | 43.8 km | 5,158 m | Mount Hood area, Oregon | usgs.gov |
| 6/29/02 | 11:49 AM | 3.8 | 42.4 km | 4,959 m | Mount Hood area, Oregon | usgs.gov |
| 6/29/02 | 7:41 AM | 3.2 | 43.9 km | 1,299 m | Mount Hood area, Oregon | usgs.gov |
| 6/29/02 | 7:36 AM | 4.5 | 43 km | 4,915 m | Mount Hood area, Oregon | usgs.gov |
| 1/14/99 | 3:56 AM | 3.2 | 43.9 km | 6,131 m | Mount Hood area, Oregon | usgs.gov |
| 1/11/99 | 2:04 PM | 3.2 | 45.5 km | 5,491 m | Mount Hood area, Oregon | usgs.gov |
| 10/19/90 | 7:13 AM | 3.5 | 42.4 km | 4,611 m | Mount Hood area, Oregon | usgs.gov |
| 9/15/89 | 3:28 AM | 3.5 | 38.5 km | 3,791 m | Mount Hood area, Oregon | usgs.gov |
| 8/18/82 | 4:50 AM | 3.4 | 38.9 km | 4,130 m | Mount Hood area, Oregon | usgs.gov |
Find historical earthquake occurrences near Stevenson, Washington
Earliest Date Latest Date
Magnitude 3.0 and greater Magnitude 4.0 and greater Magnitude 5.0 and greater

Stevenson, Washington
Stevenson is a city in Skamania County, Washington, United States. The population was 1,465 at the 2010 census, a 22% increase over 2000. It is the county seat of Skamania County and home to the Skamania County Court House and Sheriff's Office. Steve.. Stevenson, Washington Wikipedia Page
About Our Data
The data on this page is estimated using a number of publicly available tools and resources. It is provided without warranty, and could contain inaccuracies. Use at your own risk. See here for more information.