Businesses in Tybee Island, Georgia
Hotels & Travel
Restaurants
Automotive
Financial Services
Medical
Beauty & Spas
Community & Government
Industries
Business Distribution by Industry Shopping: 18.7%
Hotels & Travel: 16.5%
Restaurants: 14.6%
Home Services: 10.1%
Professional Services: 6.4%
Food: 5.4%
Other: 28.2%
| Industry Description | Number of Establishments | Average Age of Business | Average Google Rating | Businesses per 1,000 residents |
|---|---|---|---|---|
| Boats | 6 | 26.7 years | 4.6 | 1.9 |
| Public administration | 5 | 3.7 | 1.6 | |
| Art galleries | 7 | 20.4 years | 3.7 | 2.2 |
| Creative arts | 6 | 4.0 | 1.9 | |
| Museums | 6 | 4.4 | 1.9 | |
| Atm's | 10 | 3.0 | 3.2 | |
| Banks | 10 | 4.6 | 3.2 | |
| Finance other | 6 | 29.1 years | 4.6 | 1.9 |
| Loan companies | 9 | 23.8 years | 5.0 | 2.9 |
| Grocery stores and supermarkets | 7 | 4.2 | 2.2 | |
| Seafood stores | 9 | 25.8 years | 4.3 | 2.9 |
| Apartments | 13 | 31.7 years | 4.4 | 4.1 |
| General contractors | 11 | 31.8 years | 4.7 | 3.5 |
| Real estate | 41 | 27.2 years | 4.3 | 13.0 |
| Bed and breakfasts | 12 | 26.7 years | 3.9 | 3.8 |
| Holiday homes, cabins and resorts | 25 | 28.3 years | 3.9 | 7.9 |
| Hotels and motels | 28 | 35.5 years | 3.8 | 8.9 |
| Other accommodation | 52 | 33.4 years | 3.9 | 16.5 |
| Tour operators | 5 | 4.7 | 1.6 | |
| Travel agencies | 11 | 23.1 years | 4.1 | 3.5 |
| Travel and transportation | 5 | 3.7 | 1.6 | |
| All membership organizations | 5 | 31.1 years | 4.6 | 1.6 |
| Construction of buildings | 7 | 24.5 years | 3.8 | 2.2 |
| Photography | 6 | 5.0 | 1.9 | |
| Health and medical | 17 | 4.1 | 5.4 | |
| Scientific and technical services | 9 | 27.4 years | 3.7 | 2.9 |
| Churches | 5 | 36.3 years | 4.8 | 1.6 |
| American restaurants | 9 | 29.1 years | 4.1 | 2.9 |
| Bars, pubs and taverns | 21 | 21.7 years | 4.3 | 6.7 |
| Sandwich shops | 6 | 34.3 years | 4.1 | 1.9 |
| Seafood restaurants | 12 | 32.7 years | 4.2 | 3.8 |
| Bridal shops | 8 | 4.6 | 2.5 | |
| Clothing stores | 15 | 31.7 years | 4.1 | 4.8 |
| Gifts, cards and party supplies | 14 | 31.1 years | 4.5 | 4.4 |
| Rental equipment | 6 | 4.0 | 1.9 | |
| Shopping other | 14 | 33.1 years | 4.2 | 4.4 |
| Sporting goods | 14 | 22.5 years | 4.5 | 4.4 |
| Public parks | 6 | 4.1 | 1.9 |
| Area of Tybee Island, Georgia | 3.205 sq mi |
| Population | 3,147 |
| Male Population | 1,525 (48.5%) |
| Female Population | 1,622 (51.5%) |
| Population change from 1975 to 2015 | +218.2% |
| Population change from 2000 to 2015 | +20% |
| Median Age | 53 |
| Male Median Age | 52.2 |
| Female Median Age | 53.7 |
| Area Codes | 912 |
| Neighborhoods | Tybee Island |
| Local Time | Thursday 10:56 PM |
| Timezone | Eastern Daylight Time |
| Lat & Lng | 32.00022° / -80.84567° |
| Zip Codes | 31328 |
Tybee Island, Georgia - Map
Tybee Island, Georgia Population
Years 1975 to 2015| Data | 1975 | 1990 | 2000 | 2015 |
|---|---|---|---|---|
| Population | 989 | 1,801 | 2,622 | 3,147 |
| Population Density | 308.6 / mi² | 562.0 / mi² | 818.2 / mi² | 982.0 / mi² |
Tybee Island, Georgia Population change from 2000 to 2015
Increase of 20% from year 2000 to 2015| Location | Change since 1975 | Change since 1990 | Change since 2000 |
|---|---|---|---|
| Tybee Island, Georgia | +218.2% | +74.7% | +20% |
| Georgia | +93.8% | +53.1% | +27.8% |
| United States | +46.9% | +27.2% | +13.7% |
Tybee Island, Georgia Median Age
Median Age: 53 years| Location | Median Age | Median Age (Female) | Median Age (Male) |
|---|---|---|---|
| Tybee Island, Georgia | 53 years | 53.7 years | 52.2 years |
| Georgia | 35.4 years | 36.6 years | 34.2 years |
| United States | 37.4 years | 38.7 years | 36.1 years |
Tybee Island, Georgia Population Tree
Population By Age and Gender| Age | Male | Female | Total |
|---|---|---|---|
| Under 5 | 50 | 33 | 84 |
| 5-9 | 59 | 67 | 127 |
| 10-14 | 40 | 56 | 97 |
| 15-19 | 51 | 50 | 102 |
| 20-24 | 86 | 62 | 148 |
| 25-29 | 61 | 57 | 119 |
| 30-34 | 56 | 42 | 99 |
| 35-39 | 72 | 75 | 147 |
| 40-44 | 105 | 99 | 204 |
| 45-49 | 120 | 129 | 249 |
| 50-54 | 143 | 188 | 332 |
| 55-59 | 167 | 192 | 360 |
| 60-64 | 190 | 181 | 371 |
| 65-69 | 136 | 154 | 291 |
| 70-74 | 90 | 77 | 168 |
| 75-79 | 59 | 68 | 127 |
| 80-84 | 24 | 47 | 71 |
| 85 Plus | 15 | 45 | 60 |
Tybee Island, Georgia Population Density
Population Density: 982.0 / mi²| Location | Population | Area | Population Density |
|---|---|---|---|
| Tybee Island, Georgia | 3,147 | 3.205 sq mi | 982.0 / mi² |
| Georgia | 10.5 million | 59,425.5 sq mi | 176.8 / mi² |
| United States | 321.6 million | 3,796,761.2 sq mi | 84.7 / mi² |
Tybee Island, Georgia Historical and Projected Population
Estimated Population from 1975 to 2100Sources:
1. JRC (European Commission's Joint Research Centre) work on the GHS built-up grid
2. CIESIN (Center for International Earth Science Information Network)
3. [Link] Klein Goldewijk, K., Beusen, A., Doelman, J., and Stehfest, E.: Anthropogenic land use estimates for the Holocene – HYDE 3.2, Earth Syst. Sci. Data, 9, 927–953, https://doi.org/10.5194/essd-9-927-2017, 2017.
Neighborhoods
Business Distribution by neighborhood in Tybee Island, Georgia Tybee Island: 93.5%
Berkshire Woods: 3.2%
Chatham Parkway: 3.2%
Business distribution by price for Tybee Island, Georgia
Inexpensive: 41.4%
Moderate: 40.4%
Expensive: 15.2%
Very Expensive: 3%
Human Development Index (HDI)
Statistic composite index of life expectancy, education, and per capita income.Sources: [Link] Kummu, M., Taka, M. & Guillaume, J. Gridded global datasets for Gross Domestic Product and Human Development Index over 1990–2015. Sci Data 5, 180004 (2018) doi:10.1038/sdata.2018.4
Tybee Island, Georgia CO2 Emissions
Carbon Dioxide (CO2) Emissions Per Capita in Tonnes Per Year| Location | CO2 Emissions | CO2 Emissions Per Capita | CO2 Emissions Intensity |
|---|---|---|---|
| Tybee Island, Georgia | 86,916 tn | 27.6 tn | 27,121 tons/mi² |
| Georgia | 183,571,844 tn | 17.5 tn | 3,089 tons/mi² |
| United States | 5,664,619,809 tn | 17.6 tn | 1,491 tons/mi² |
Tybee Island, Georgia CO2 Emissions
| 2013 CO2 emissions (tonnes/year) | 86,916 tn |
| 2013 CO2 emissions (tonnes/year) per capita | 27.6 tn |
| 2013 CO2 emissions intensity (tonnes/mi²/year) |
Natural Hazards Risk
Relative risk out of 10| Cyclone | High (8) |
| Flood | Medium (4) |
* Risk, particularly concerning flood or landslide, may not be for the entire area.
Sources: 1. Dilley, M., R.S. Chen, U. Deichmann, A.L. Lerner-Lam, M. Arnold, J. Agwe, P. Buys, O. Kjekstad, B. Lyon, and G. Yetman. 2005. Natural Disaster Hotspots: A Global Risk Analysis. Washington, D.C.: World Bank. https://doi.org/10.1596/0-8213-5930-4.
2. Center for Hazards and Risk Research - CHRR - Columbia University, Center for International Earth Science Information Network - CIESIN - Columbia University. 2005. Global Flood Hazard Frequency and Distribution. Palisades, NY: NASA Socioeconomic Data and Applications Center (SEDAC). https://doi.org/10.7927/H4668B3D.
3. Center for Hazards and Risk Research - CHRR - Columbia University, Center for International Earth Science Information Network - CIESIN - Columbia University, International Bank for Reconstruction and Development - The World Bank, and United Nations Environment Programme Global Resource Information Database Geneva - UNEP/GRID-Geneva. 2005. Global Cyclone Hazard Frequency and Distribution. Palisades, NY: NASA Socioeconomic Data and Applications Center (SEDAC). https://doi.org/10.7927/H4CZ353K.
Recent Nearby Earthquakes
Magnitude 3.0 and greater
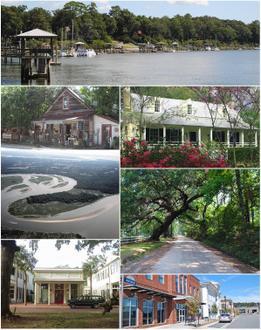
Tybee Island, Georgia
Tybee Island is an island and city in Chatham County, Georgia, near the city of Savannah in the southeastern United States. It is the easternmost point in the state of Georgia. As of the 2010 census, the city population was 2,990. The city of Tybee I.. Tybee Island, Georgia Wikipedia Page
About Our Data
The data on this page is estimated using a number of publicly available tools and resources. It is provided without warranty, and could contain inaccuracies. Use at your own risk. See here for more information.