Businesses in Young Harris, Georgia
Hotels & Travel
Restaurants
Automotive
Financial Services
Medical
Beauty & Spas
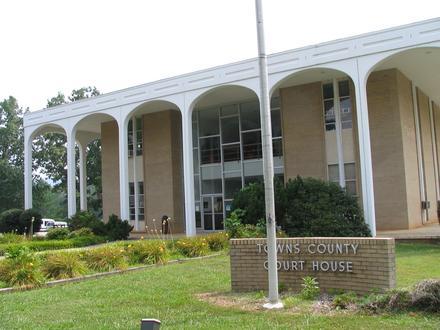
Community & Government
Industries
Business Distribution by Industry Shopping: 18.6%
Home Services: 9.9%
Professional Services: 9.9%
Industry: 8.5%
Restaurants: 7.9%
Automotive: 6.9%
Medical: 4.9%
Other: 33.3%
| Industry Description | Number of Establishments | Average Age of Business | Average Google Rating | Businesses per 1,000 residents |
|---|---|---|---|---|
| Car repair | 6 | 3.7 | 6.3 | |
| Gas stations | 7 | 39.5 years | 4.0 | 7.4 |
| Beauty salons | 7 | 29.7 years | 3.8 | 7.4 |
| Hairdressers | 5 | 30.9 years | 3.6 | 5.3 |
| Government agencies | 5 | 4.1 | 5.3 | |
| Public administration | 16 | 41.2 years | 4.5 | 16.9 |
| Convenience stores | 6 | 4.0 | 6.3 | |
| Grocery stores and supermarkets | 6 | 23.8 years | 4.5 | 6.3 |
| Electrical installation | 6 | 2.4 | 6.3 | |
| General contractors | 18 | 25.3 years | 4.7 | 19.0 |
| Real estate | 20 | 22.7 years | 4.4 | 21.1 |
| Hotels and motels | 7 | 24.5 years | 4.5 | 7.4 |
| Other accommodation | 6 | 24.5 years | 4.5 | 6.3 |
| Construction of buildings | 10 | 28.3 years | 5.0 | 10.5 |
| Personal services | 6 | 28.8 years | 6.3 | |
| Physiotherapy | 5 | 5.0 | 5.3 | |
| Pet grooming and boarding | 5 | 25.5 years | 4.8 | 5.3 |
| Accountants | 6 | 38.1 years | 5.0 | 6.3 |
| Corporate management | 7 | 29.9 years | 7.4 | |
| Scientific and technical services | 7 | 20.3 years | 4.0 | 7.4 |
| Churches | 11 | 43.3 years | 4.7 | 11.6 |
| American restaurants | 5 | 4.5 | 5.3 | |
| Shopping other | 7 | 20.3 years | 3.5 | 7.4 |
| Area of Young Harris, Georgia | 1.004 sq mi |
| Population | 948 |
| Male Population | 440 (46.4%) |
| Female Population | 508 (53.6%) |
| Population change from 1975 to 2015 | +100.8% |
| Population change from 2000 to 2015 | +17.3% |
| Median Age | 19.4 |
| Male Median Age | 19.6 |
| Female Median Age | 19.3 |
| Area Codes | 706 |
| Local Time | Saturday 11:20 PM |
| Timezone | Eastern Daylight Time |
| Lat & Lng | 34.93315° / -83.84712° |
| Zip Codes | 30582 |
Young Harris, Georgia - Map
Young Harris, Georgia Population
Years 1975 to 2015| Data | 1975 | 1990 | 2000 | 2015 |
|---|---|---|---|---|
| Population | 472 | 713 | 808 | 948 |
| Population Density | 470.2 / mi² | 710.3 / mi² | 804.9 / mi² | 944.3 / mi² |
Young Harris, Georgia Population change from 2000 to 2015
Increase of 17.3% from year 2000 to 2015| Location | Change since 1975 | Change since 1990 | Change since 2000 |
|---|---|---|---|
| Young Harris, Georgia | +100.8% | +33% | +17.3% |
| Georgia | +93.8% | +53.1% | +27.8% |
| United States | +46.9% | +27.2% | +13.7% |
Young Harris, Georgia Median Age
Median Age: 19.4 years| Location | Median Age | Median Age (Female) | Median Age (Male) |
|---|---|---|---|
| Young Harris, Georgia | 19.4 years | 19.3 years | 19.6 years |
| Georgia | 35.4 years | 36.6 years | 34.2 years |
| United States | 37.4 years | 38.7 years | 36.1 years |
Young Harris, Georgia Population Tree
Population By Age and Gender| Age | Male | Female | Total |
|---|---|---|---|
| Under 5 | 11 | 11 | 23 |
| 5-9 | 13 | 17 | 30 |
| 10-14 | 12 | 8 | 20 |
| 15-19 | 198 | 252 | 450 |
| 20-24 | 117 | 116 | 233 |
| 25-29 | 12 | 8 | 20 |
| 30-34 | 8 | 10 | 18 |
| 35-39 | 11 | 10 | 21 |
| 40-44 | 8 | 7 | 15 |
| 45-49 | 4 | 9 | 14 |
| 50-54 | 8 | 5 | 14 |
| 55-59 | 10 | 11 | 21 |
| 60-64 | 8 | 13 | 22 |
| 65-69 | 7 | 5 | 13 |
| 70-74 | 6 | 7 | 14 |
| 75-79 | 3 | 5 | 8 |
| 80-84 | 3 | 11 | 14 |
| 85 Plus | 1 | 4 | 6 |
Young Harris, Georgia Population Density
Population Density: 944.3 / mi²| Location | Population | Area | Population Density |
|---|---|---|---|
| Young Harris, Georgia | 948 | 1.004 sq mi | 944.3 / mi² |
| Georgia | 10.5 million | 59,425.5 sq mi | 176.8 / mi² |
| United States | 321.6 million | 3,796,761.2 sq mi | 84.7 / mi² |
Young Harris, Georgia Historical Population
Estimated Population from 1800 to 2015Sources:
1. JRC (European Commission's Joint Research Centre) work on the GHS built-up grid
2. CIESIN (Center for International Earth Science Information Network)
3. [Link] Klein Goldewijk, K., Beusen, A., Doelman, J., and Stehfest, E.: Anthropogenic land use estimates for the Holocene – HYDE 3.2, Earth Syst. Sci. Data, 9, 927–953, https://doi.org/10.5194/essd-9-927-2017, 2017.
Business distribution by price for Young Harris, Georgia
Moderate: 48.5%
Inexpensive: 39.4%
Expensive: 12.1%
Human Development Index (HDI)
Statistic composite index of life expectancy, education, and per capita income.Sources: [Link] Kummu, M., Taka, M. & Guillaume, J. Gridded global datasets for Gross Domestic Product and Human Development Index over 1990–2015. Sci Data 5, 180004 (2018) doi:10.1038/sdata.2018.4
Young Harris, Georgia CO2 Emissions
Carbon Dioxide (CO2) Emissions Per Capita in Tonnes Per Year| Location | CO2 Emissions | CO2 Emissions Per Capita | CO2 Emissions Intensity |
|---|---|---|---|
| Young Harris, Georgia | 18,542 tn | 19.6 tn | 18,471 tons/mi² |
| Georgia | 183,571,844 tn | 17.5 tn | 3,089 tons/mi² |
| United States | 5,664,619,809 tn | 17.6 tn | 1,491 tons/mi² |
Young Harris, Georgia CO2 Emissions
| 2013 CO2 emissions (tonnes/year) | 18,542 tn |
| 2013 CO2 emissions (tonnes/year) per capita | 19.6 tn |
| 2013 CO2 emissions intensity (tonnes/mi²/year) |
Natural Hazards Risk
Relative risk out of 10| Cyclone | Medium (5) |
| Flood | High (7) |
| Earthquake | Low (2) |
* Risk, particularly concerning flood or landslide, may not be for the entire area.
Sources: 1. Dilley, M., R.S. Chen, U. Deichmann, A.L. Lerner-Lam, M. Arnold, J. Agwe, P. Buys, O. Kjekstad, B. Lyon, and G. Yetman. 2005. Natural Disaster Hotspots: A Global Risk Analysis. Washington, D.C.: World Bank. https://doi.org/10.1596/0-8213-5930-4.
2. Center for Hazards and Risk Research - CHRR - Columbia University, Center for International Earth Science Information Network - CIESIN - Columbia University. 2005. Global Flood Hazard Frequency and Distribution. Palisades, NY: NASA Socioeconomic Data and Applications Center (SEDAC). https://doi.org/10.7927/H4668B3D.
3. Center for Hazards and Risk Research - CHRR - Columbia University, Center for International Earth Science Information Network - CIESIN - Columbia University. 2005. Global Earthquake Hazard Distribution - Peak Ground Acceleration. Palisades, NY: NASA Socioeconomic Data and Applications Center (SEDAC). https://doi.org/10.7927/H4BZ63ZS.
4. Center for Hazards and Risk Research - CHRR - Columbia University, Center for International Earth Science Information Network - CIESIN - Columbia University, International Bank for Reconstruction and Development - The World Bank, and United Nations Environment Programme Global Resource Information Database Geneva - UNEP/GRID-Geneva. 2005. Global Cyclone Hazard Frequency and Distribution. Palisades, NY: NASA Socioeconomic Data and Applications Center (SEDAC). https://doi.org/10.7927/H4CZ353K.
Recent Nearby Earthquakes
Magnitude 3.0 and greater| Date | Time | Magnitude | Distance | Depth | Location | Link |
|---|---|---|---|---|---|---|
| 4/20/10 | 2:28 AM | 3.3 | 89 km | 2,240 m | 4km SW of Maryville, Tennessee | usgs.gov |
| 8/31/09 | 7:07 AM | 3.3 | 97 km | 14,250 m | 8km SW of Louisville, Tennessee | usgs.gov |
| 8/1/09 | 6:38 AM | 3.2 | 43.1 km | 5,400 m | 11km NE of McCaysville, Georgia | usgs.gov |
| 6/23/08 | 4:30 PM | 3.1 | 90.8 km | 8,760 m | 12km ENE of Varnell, Georgia | usgs.gov |
| 12/18/06 | 12:34 AM | 3.3 | 65.6 km | 17,690 m | 14km ESE of Englewood, Tennessee | usgs.gov |
| 6/15/06 | 5:57 PM | 3.4 | 87 km | 1,370 m | 9km W of Maggie Valley, North Carolina | usgs.gov |
| 5/10/06 | 5:17 AM | 3.2 | 83.2 km | 24,690 m | 3km WNW of Madisonville, Tennessee | usgs.gov |
| 4/10/06 | 8:29 PM | 3.3 | 74.8 km | 19,550 m | 5km NE of Etowah, Tennessee | usgs.gov |
| 10/11/05 | 11:27 PM | 3.3 | 90.1 km | 8,119 m | 8km NNE of Athens, Tennessee | usgs.gov |
| 7/19/97 | 10:06 AM | 3.5 | 88.8 km | 10,000 m | eastern Tennessee | usgs.gov |
Find historical earthquake occurrences near Young Harris, Georgia
Earliest Date Latest Date
Magnitude 3.0 and greater Magnitude 4.0 and greater Magnitude 5.0 and greater

Young Harris, Georgia
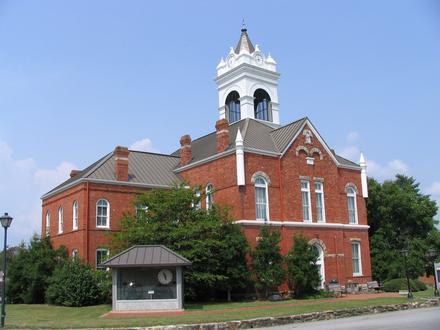
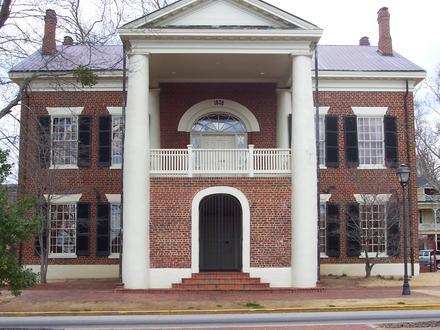
Young Harris is a city in Towns County, Georgia, United States. The population was 604 at the 2000 census. Young Harris is home to Young Harris College, after which it was named. Young Harris, Georgia Wikipedia Page

About Our Data
The data on this page is estimated using a number of publicly available tools and resources. It is provided without warranty, and could contain inaccuracies. Use at your own risk. See here for more information.