Businesses in Bentwisch
Hotels & Travel
Restaurants
Automotive
Financial Services
Medical
Beauty & Spas
Community & Government
Industries
Business Distribution by Industry Shopping: 28%
Professional Services: 15.4%
Industry: 14.6%
Home Services: 9.7%
Other: 32.3%
| Industry Description | Number of Establishments | Average Google Rating | Businesses per 1,000 residents |
|---|---|---|---|
| Car repair | 9 | 4.5 | 5.0 |
| Grocery stores and supermarkets | 5 | 4.3 | 2.8 |
| Electrical installation | 10 | 3.8 | 5.5 |
| General cleaning services | 8 | 3.5 | 4.4 |
| General contractors | 10 | 3.9 | 5.5 |
| Travel agencies | 7 | 4.3 | 3.9 |
| Construction of buildings | 11 | 4.2 | 6.1 |
| Wholesale of machinery | 7 | 3.9 | |
| Laundry | 6 | 4.2 | 3.3 |
| Corporate management | 6 | 4.3 | 3.3 |
| Technical construction services | 14 | 4.1 | 7.7 |
| Clothing stores | 12 | 4.1 | 6.6 |
| Electronics stores | 10 | 5.0 | 5.5 |
| Furniture stores | 6 | 3.8 | 3.3 |
| Hardware stores | 12 | 3.8 | 6.6 |
| Household appliances and goods | 5 | 3.7 | 2.8 |
| Area of Bentwisch, Mecklenburg-Vorpommern | 2.261 km² |
| Population | 1,813 |
| Male Population | 920 (50.7%) |
| Female Population | 893 (49.3%) |
| Population change from 1975 to 2015 | +6.3% |
| Population change from 2000 to 2015 | -7.4% |
| Median Age | 47.3 |
| Male Median Age | 45.7 |
| Female Median Age | 48.9 |
| Area Codes | 381 |
| Neighborhoods | Goorstorf, Harmstorf, Mitte, Neu Bartelsdorf |
| Local Time | Friday 5:25 PM |
| Timezone | Central European Summer Time |
| Lat & Lng | 54.11503° / 12.20465° |
| Postal Codes | 18182 |
Bentwisch, Mecklenburg-Vorpommern - Map
Bentwisch, Mecklenburg-Vorpommern Population
Years 1975 to 2015| Data | 1975 | 1990 | 2000 | 2015 |
|---|---|---|---|---|
| Population | 1,705 | 1,745 | 1,958 | 1,813 |
| Population Density | 754.0 / km² | 771.7 / km² | 865.9 / km² | 801.8 / km² |
Bentwisch Population change from 2000 to 2015
Decrease of 7.4% from year 2000 to 2015| Location | Change since 1975 | Change since 1990 | Change since 2000 |
|---|---|---|---|
| Bentwisch, Mecklenburg-Vorpommern | +6.3% | +3.9% | -7.4% |
| Mecklenburg-Vorpommern | -19.6% | -12.3% | -10.1% |
| Germany | +2.6% | +2.2% | -1.5% |
Bentwisch, Mecklenburg-Vorpommern Median Age
Median Age: 47.3 years| Location | Median Age | Median Age (Female) | Median Age (Male) |
|---|---|---|---|
| Bentwisch, Mecklenburg-Vorpommern | 47.3 years | 48.9 years | 45.7 years |
| Mecklenburg-Vorpommern | 47.6 years | 49.1 years | 46 years |
| Germany | 44.8 years | 46 years | 43.6 years |
Bentwisch, Mecklenburg-Vorpommern Population Tree
Population By Age and Gender| Age | Male | Female | Total |
|---|---|---|---|
| Under 5 | 37 | 35 | 72 |
| 5-9 | 36 | 33 | 70 |
| 10-14 | 35 | 31 | 67 |
| 15-19 | 30 | 27 | 57 |
| 20-24 | 67 | 58 | 125 |
| 25-29 | 67 | 55 | 122 |
| 30-34 | 60 | 47 | 108 |
| 35-39 | 50 | 41 | 92 |
| 40-44 | 66 | 59 | 126 |
| 45-49 | 87 | 78 | 165 |
| 50-54 | 83 | 76 | 160 |
| 55-59 | 77 | 73 | 151 |
| 60-64 | 53 | 52 | 106 |
| 65-69 | 48 | 51 | 99 |
| 70-74 | 59 | 68 | 127 |
| 75-79 | 38 | 49 | 87 |
| 80-84 | 19 | 34 | 54 |
| 85 Plus | 8 | 26 | 35 |
Bentwisch, Mecklenburg-Vorpommern Population Density
Population Density: 801.8 / km²| Location | Population | Area | Population Density |
|---|---|---|---|
| Bentwisch, Mecklenburg-Vorpommern | 1,813 | 2.261 km² | 801.8 / km² |
| Mecklenburg-Vorpommern | 1.6 million | 23,289 km² | 66.9 / km² |
| Germany | 80.7 million | 358,179.8 km² | 225.2 / km² |
Bentwisch, Mecklenburg-Vorpommern Historical Population
Estimated Population from 1200 to 2015Sources:
1. JRC (European Commission's Joint Research Centre) work on the GHS built-up grid
2. CIESIN (Center for International Earth Science Information Network)
3. [Link] Klein Goldewijk, K., Beusen, A., Doelman, J., and Stehfest, E.: Anthropogenic land use estimates for the Holocene – HYDE 3.2, Earth Syst. Sci. Data, 9, 927–953, https://doi.org/10.5194/essd-9-927-2017, 2017.
Neighborhoods
Business Distribution by neighborhood in Bentwisch Neu Bartelsdorf: 52.1%
Goorstorf: 30.8%
Harmstorf: 6%
Other: 11.1%
Human Development Index (HDI)
Statistic composite index of life expectancy, education, and per capita income.Sources: [Link] Kummu, M., Taka, M. & Guillaume, J. Gridded global datasets for Gross Domestic Product and Human Development Index over 1990–2015. Sci Data 5, 180004 (2018) doi:10.1038/sdata.2018.4
Bentwisch, Mecklenburg-Vorpommern CO2 Emissions
Carbon Dioxide (CO2) Emissions Per Capita in Tonnes Per Year| Location | CO2 Emissions | CO2 Emissions Per Capita | CO2 Emissions Intensity |
|---|---|---|---|
| Bentwisch, Mecklenburg-Vorpommern | 17,162 tn | 9.47 tn | 7,589 tons/km² |
| Mecklenburg-Vorpommern | 14,301,724 tn | 9.18 tn | 614.1 tons/km² |
| Germany | 755,339,039 tn | 9.36 tn | 2,108 tons/km² |
Bentwisch, Mecklenburg-Vorpommern CO2 Emissions
| 2013 CO2 emissions (tonnes/year) | 17,162 tn |
| 2013 CO2 emissions (tonnes/year) per capita | 9.47 tn |
| 2013 CO2 emissions intensity (tonnes/km²/year) | 7,589 tons/km² |
Recent Nearby Earthquakes
Magnitude 3.0 and greater| Date | Time | Magnitude | Distance | Depth | Location | Link |
|---|---|---|---|---|---|---|
| 7/21/01 | 9:35 AM | 3.5 | 23.2 km | 10,000 m | Germany | usgs.gov |
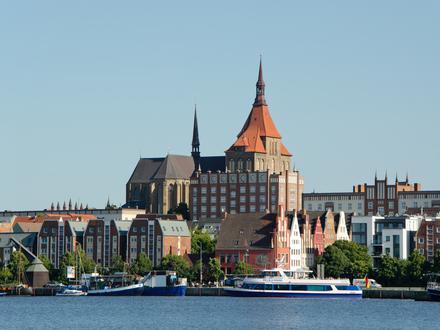
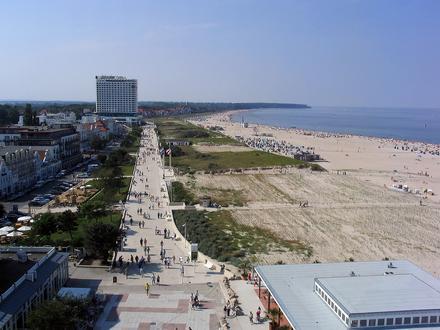
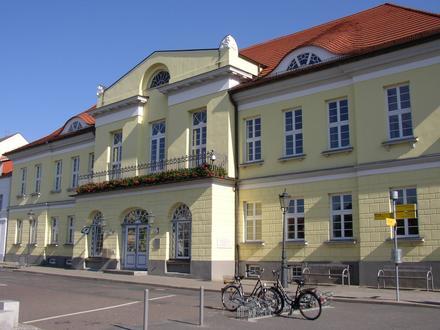
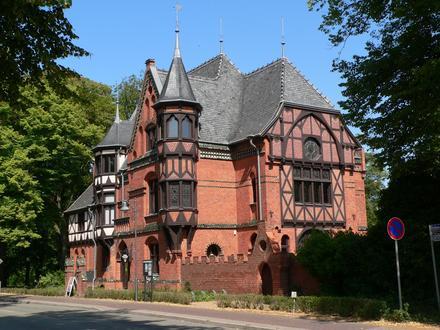
Bentwisch, Mecklenburg-Vorpommern
Bentwisch is a municipality in the Rostock district, in Mecklenburg-Vorpommern, Germany, to the east of Rostock. The village has 2.455 inhabitants and covers 14.74 square kilometres. Due to its proximity to Rostock, the B 105, and the A 19, Bentwisch.. Bentwisch Wikipedia Page
About Our Data
The data on this page is estimated using a number of publicly available tools and resources. It is provided without warranty, and could contain inaccuracies. Use at your own risk. See here for more information.