Businesses in Amagasaki
Hotels & Travel
Restaurants
Automotive
Financial Services
Medical
Beauty & Spas
Community & Government
Industries
Business Distribution by Industry Shopping: 16.4%
Restaurants: 16.3%
Industry: 10.1%
Home Services: 9.3%
Medical: 8.2%
Food: 7.3%
Professional Services: 5.7%
Beauty & Spas: 5.1%
Other: 21.5%
| Industry Description | Number of Establishments | Average Google Rating | Businesses per 1,000 residents |
|---|---|---|---|
| Beauty salons | 472 | 3.9 | 1.2 |
| Hairdressers | 488 | 3.9 | 1.2 |
| Public administration | 355 | 3.3 | 0.9 |
| Banks | 185 | 3.5 | 0.5 |
| Loan companies | 250 | 3.3 | 0.6 |
| Convenience stores | 254 | 3.1 | 0.6 |
| Grocery stores and supermarkets | 453 | 3.6 | 1.1 |
| General contractors | 238 | 3.5 | 0.6 |
| Real estate | 430 | 3.5 | 1.1 |
| Wholesale of construction supplies | 181 | 4.0 | 0.4 |
| Wholesale of machinery | 195 | 3.2 | 0.5 |
| Dentists | 266 | 3.7 | 0.7 |
| Health and medical | 877 | 3.4 | 2.2 |
| Hospitals | 230 | 3.3 | 0.6 |
| Bars, pubs and taverns | 219 | 3.8 | 0.5 |
| Cafes | 295 | 3.7 | 0.7 |
| Japanese restaurants | 516 | 3.7 | 1.3 |
| Pharmacies and drug stores | 330 | 3.6 | 0.8 |
| Area of Amagasaki, Hyōgo Prefecture | 49.8 km² |
| Population | 406,130 |
| Male Population | 197,799 (48.7%) |
| Female Population | 208,331 (51.3%) |
| Population change from 1975 to 2015 | +11.9% |
| Population change from 2000 to 2015 | -0% |
| Median Age | 45.1 |
| Male Median Age | 43.6 |
| Female Median Age | 46.5 |
| Area Codes | 6 |
| Local Time | Thursday 12:33 PM |
| Timezone | Japan Standard Time |
| Lat & Lng | 34.71667° / 135.41667° |
| Postal Codes | 561, 660, 661, 663, 664 |
Amagasaki, Hyōgo Prefecture - Map
Amagasaki, Hyōgo Prefecture Population
Years 1975 to 2015| Data | 1975 | 1990 | 2000 | 2015 |
|---|---|---|---|---|
| Population | 362,927 | 399,182 | 406,323 | 406,130 |
| Population Density | 7,292 / km² | 8,020 / km² | 8,164 / km² | 8,160 / km² |
Amagasaki Population change from 2000 to 2015
Decrease of 0% from year 2000 to 2015| Location | Change since 1975 | Change since 1990 | Change since 2000 |
|---|---|---|---|
| Amagasaki, Hyōgo Prefecture | +11.9% | +1.7% | -0% |
| Hyogo Prefecture | +12.6% | +2.2% | -0.2% |
| Japan | +13.6% | +3.4% | +0.6% |
Amagasaki, Hyōgo Prefecture Median Age
Median Age: 45.1 years| Location | Median Age | Median Age (Female) | Median Age (Male) |
|---|---|---|---|
| Amagasaki, Hyōgo Prefecture | 45.1 years | 46.5 years | 43.6 years |
| Hyogo Prefecture | 45.1 years | 46.5 years | 43.6 years |
| Japan | 45.2 years | 46.9 years | 43.5 years |
Amagasaki, Hyōgo Prefecture Population Tree
Population By Age and Gender| Age | Male | Female | Total |
|---|---|---|---|
| Under 5 | 8,392 | 8,076 | 16,468 |
| 5-9 | 8,310 | 7,778 | 16,089 |
| 10-14 | 8,479 | 8,206 | 16,686 |
| 15-19 | 8,957 | 8,508 | 17,466 |
| 20-24 | 9,836 | 10,035 | 19,871 |
| 25-29 | 12,073 | 12,125 | 24,198 |
| 30-34 | 14,385 | 14,131 | 28,517 |
| 35-39 | 17,445 | 16,848 | 34,294 |
| 40-44 | 15,377 | 14,731 | 30,109 |
| 45-49 | 12,870 | 12,657 | 25,527 |
| 50-54 | 11,143 | 10,997 | 22,140 |
| 55-59 | 12,884 | 13,131 | 26,016 |
| 60-64 | 16,374 | 17,111 | 33,485 |
| 65-69 | 14,251 | 15,257 | 29,508 |
| 70-74 | 11,470 | 13,195 | 24,665 |
| 75-79 | 8,207 | 10,858 | 19,066 |
| 80-84 | 4,785 | 7,541 | 12,327 |
| 85 Plus | 2,561 | 7,147 | 9,709 |
Amagasaki, Hyōgo Prefecture Population Density
Population Density: 8,160 / km²| Location | Population | Area | Population Density |
|---|---|---|---|
| Amagasaki, Hyōgo Prefecture | 406,130 | 49.8 km² | 8,160 / km² |
| Hyogo Prefecture | 5.4 million | 8,396.6 km² | 644.9 / km² |
| Japan | 122.9 million | 373,410.9 km² | 329.2 / km² |
Amagasaki, Hyōgo Prefecture Historical Population
Estimated Population from 1600 to 2015Sources:
1. JRC (European Commission's Joint Research Centre) work on the GHS built-up grid
2. CIESIN (Center for International Earth Science Information Network)
3. [Link] Klein Goldewijk, K., Beusen, A., Doelman, J., and Stehfest, E.: Anthropogenic land use estimates for the Holocene – HYDE 3.2, Earth Syst. Sci. Data, 9, 927–953, https://doi.org/10.5194/essd-9-927-2017, 2017.
Business distribution by price for Amagasaki, Hyōgo Prefecture
Moderate: 62.4%
Inexpensive: 33.7%
Expensive: 3.7%
Very Expensive: 0.2%
Human Development Index (HDI)
Statistic composite index of life expectancy, education, and per capita income.Sources: [Link] Kummu, M., Taka, M. & Guillaume, J. Gridded global datasets for Gross Domestic Product and Human Development Index over 1990–2015. Sci Data 5, 180004 (2018) doi:10.1038/sdata.2018.4
Amagasaki, Hyōgo Prefecture CO2 Emissions
Carbon Dioxide (CO2) Emissions Per Capita in Tonnes Per Year| Location | CO2 Emissions | CO2 Emissions Per Capita | CO2 Emissions Intensity |
|---|---|---|---|
| Amagasaki, Hyōgo Prefecture | 425,643 tn | 1.05 tn | 8,552 tons/km² |
| Hyogo Prefecture | 5,432,186 tn | 1 tn | 647 tons/km² |
| Japan | 541,995,101 tn | 4.41 tn | 1,451 tons/km² |
Amagasaki, Hyōgo Prefecture CO2 Emissions
| 2013 CO2 emissions (tonnes/year) | 425,643 tn |
| 2013 CO2 emissions (tonnes/year) per capita | 1.05 tn |
| 2013 CO2 emissions intensity (tonnes/km²/year) | 8,552 tons/km² |
Natural Hazards Risk
Relative risk out of 10| Landslide | Medium (6) |
| Cyclone | High (9) |
| Flood | High (7) |
| Earthquake | High (8) |
* Risk, particularly concerning flood or landslide, may not be for the entire area.
Sources: 1. Dilley, M., R.S. Chen, U. Deichmann, A.L. Lerner-Lam, M. Arnold, J. Agwe, P. Buys, O. Kjekstad, B. Lyon, and G. Yetman. 2005. Natural Disaster Hotspots: A Global Risk Analysis. Washington, D.C.: World Bank. https://doi.org/10.1596/0-8213-5930-4.
2. Center for Hazards and Risk Research - CHRR - Columbia University, Center for International Earth Science Information Network - CIESIN - Columbia University. 2005. Global Flood Hazard Frequency and Distribution. Palisades, NY: NASA Socioeconomic Data and Applications Center (SEDAC). https://doi.org/10.7927/H4668B3D.
3. Center for Hazards and Risk Research - CHRR - Columbia University, Center for International Earth Science Information Network - CIESIN - Columbia University. 2005. Global Earthquake Hazard Distribution - Peak Ground Acceleration. Palisades, NY: NASA Socioeconomic Data and Applications Center (SEDAC). https://doi.org/10.7927/H4BZ63ZS.
4. Center for Hazards and Risk Research - CHRR - Columbia University, Center for International Earth Science Information Network - CIESIN - Columbia University, International Bank for Reconstruction and Development - The World Bank, and United Nations Environment Programme Global Resource Information Database Geneva - UNEP/GRID-Geneva. 2005. Global Cyclone Hazard Frequency and Distribution. Palisades, NY: NASA Socioeconomic Data and Applications Center (SEDAC). https://doi.org/10.7927/H4CZ353K.
5. Center for Hazards and Risk Research - CHRR - Columbia University, Center for International Earth Science Information Network - CIESIN - Columbia University, and Norwegian Geotechnical Institute - NGI. 2005. Global Landslide Hazard Distribution. Palisades, NY: NASA Socioeconomic Data and Applications Center (SEDAC). https://doi.org/10.7927/H4P848VZ.
Recent Nearby Earthquakes
Magnitude 3.0 and greater| Date | Time | Magnitude | Distance | Depth | Location | Link |
|---|---|---|---|---|---|---|
| 6/10/19 | 12:30 PM | 4.2 | 38.5 km | 366,200 m | 5km NW of Muko, Japan | usgs.gov |
| 7/7/18 | 11:45 PM | 3.8 | 30.5 km | 10,000 m | 4km SSW of Kameoka, Japan | usgs.gov |
| 6/23/18 | 7:08 AM | 3.9 | 26.3 km | 10,000 m | 2km NE of Hirakata, Japan | usgs.gov |
| 6/18/18 | 3:52 PM | 3.7 | 21.9 km | 10,000 m | 1km ENE of Neyagawa, Japan | usgs.gov |
| 6/18/18 | 8:31 AM | 4.6 | 19.4 km | 10,000 m | 2km NNW of Neyagawa, Japan | usgs.gov |
| 6/17/18 | 3:58 PM | 5.5 | 23.6 km | 10,340 m | 1km NW of Hirakata, Japan | usgs.gov |
| 11/17/14 | 1:07 PM | 4.3 | 35.2 km | 14,540 m | 8km ESE of Akashi, Japan | usgs.gov |
| 8/5/14 | 9:17 AM | 4.4 | 33.1 km | 26,690 m | 4km W of Kameoka, Japan | usgs.gov |
| 7/19/14 | 10:35 PM | 4 | 26.4 km | 373,250 m | 3km ESE of Hirakata, Japan | usgs.gov |
| 7/16/13 | 8:07 PM | 4.4 | 36.1 km | 59,400 m | near the south coast of western Honshu, Japan | usgs.gov |
Find historical earthquake occurrences near Amagasaki, Hyōgo Prefecture
Earliest Date Latest Date
Magnitude 3.0 and greater Magnitude 4.0 and greater Magnitude 5.0 and greater

Amagasaki, Hyōgo Prefecture
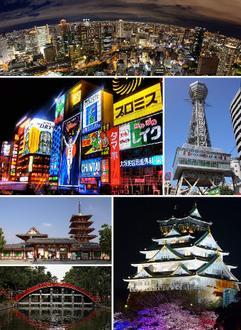
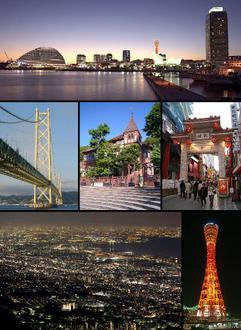
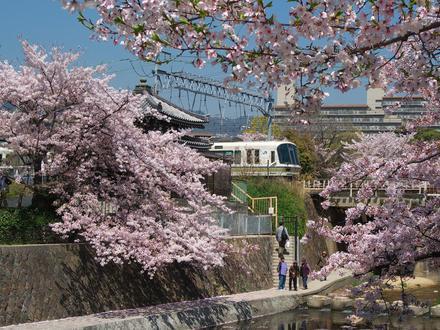
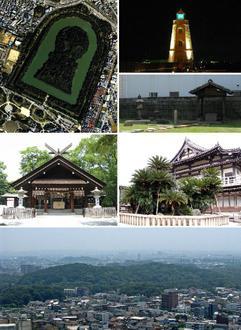
Amagasaki (尼崎市, Amagasaki-shi) is an industrial city located in Hyōgo Prefecture, Japan. The city was founded on April 1, 1916. Its population is around 460,000, below its peak of over 554,000 in 1971. of 2012, the city has an estimated population o.. Amagasaki Wikipedia Page
Postal Codes
Percentage of businesses by Postal Codes in Amagasaki Postal Code 661: 56.4%
Postal Code 660: 41.5%
Other: 2.1%
About Our Data
The data on this page is estimated using a number of publicly available tools and resources. It is provided without warranty, and could contain inaccuracies. Use at your own risk. See here for more information.