Businesses in Goyang
Hotels & Travel
Restaurants
Automotive
Financial Services
Medical
Beauty & Spas
Community & Government
Industries
Business Distribution by Industry Restaurants: 23.8%
Shopping: 17.7%
Home Services: 12.2%
Industry: 9.9%
Food: 6.3%
Other: 30%
| Industry Description | Number of Establishments | Average Google Rating | Businesses per 1,000 residents |
|---|---|---|---|
| Car repair | 338 | 4.1 | 0.4 |
| Banks | 218 | 3.7 | 0.3 |
| Loan companies | 237 | 3.6 | 0.3 |
| Bakeries | 342 | 4.0 | 0.4 |
| Grocery stores and supermarkets | 651 | 3.9 | 0.8 |
| Street vendors | 316 | 3.8 | 0.4 |
| Apartments | 413 | 4.3 | 0.5 |
| Real estate | 671 | 3.7 | 0.9 |
| Construction of buildings | 280 | 3.9 | 0.4 |
| Dentists | 269 | 4.0 | 0.4 |
| Health and medical | 823 | 3.6 | 1.1 |
| Hospitals | 231 | 3.6 | 0.3 |
| Churches | 431 | 4.1 | 0.6 |
| Bars, pubs and taverns | 280 | 4.0 | 0.4 |
| Cafes | 677 | 4.0 | 0.9 |
| Japanese restaurants | 225 | 3.8 | 0.3 |
| Korean restaurants | 1,420 | 3.9 | 1.8 |
| Clothing stores | 322 | 4.0 | 0.4 |
| Pharmacies and drug stores | 363 | 3.9 | 0.5 |
| Area of Goyang, Gyeonggi Province | 267.3 km² |
| Population | 768,374 |
| Male Population | 375,495 (48.9%) |
| Female Population | 392,880 (51.1%) |
| Population change from 1975 to 2015 | +170.9% |
| Population change from 2000 to 2015 | +27.5% |
| Median Age | 37.5 |
| Male Median Age | 36.9 |
| Female Median Age | 38 |
| Area Codes | 31 |
| Neighborhoods | Deokyang-gu, Ilsandong-gu, Ilsanseo-gu |
| Local Time | Friday 11:52 AM |
| Timezone | Korean Standard Time |
| Lat & Lng | 37.65639° / 126.835° |
| Postal Codes | 10546, 10548, 10550, 10551, 10552, More |
Goyang, Gyeonggi Province - Map
Goyang, Gyeonggi Province Population
Years 1975 to 2015| Data | 1975 | 1990 | 2000 | 2015 |
|---|---|---|---|---|
| Population | 283,664 | 461,049 | 602,658 | 768,374 |
| Population Density | 1,061 / km² | 1,724 / km² | 2,254 / km² | 2,874 / km² |
Goyang Population change from 2000 to 2015
Increase of 27.5% from year 2000 to 2015| Location | Change since 1975 | Change since 1990 | Change since 2000 |
|---|---|---|---|
| Goyang, Gyeonggi Province | +170.9% | +66.7% | +27.5% |
| Kyeongki-Do | +175.4% | +80.3% | +43.3% |
| South Korea | +44% | +16.9% | +9% |
Goyang, Gyeonggi Province Median Age
Median Age: 37.5 years| Location | Median Age | Median Age (Female) | Median Age (Male) |
|---|---|---|---|
| Goyang, Gyeonggi Province | 37.5 years | 38 years | 36.9 years |
| Kyeongki-Do | 36.5 years | 37.2 years | 35.8 years |
| South Korea | 38 years | 39.2 years | 36.8 years |
Goyang, Gyeonggi Province Population Tree
Population By Age and Gender| Age | Male | Female | Total |
|---|---|---|---|
| Under 5 | 18,052 | 16,922 | 34,975 |
| 5-9 | 22,099 | 20,444 | 42,544 |
| 10-14 | 31,246 | 28,664 | 59,911 |
| 15-19 | 32,262 | 29,775 | 62,038 |
| 20-24 | 23,780 | 22,674 | 46,455 |
| 25-29 | 22,518 | 25,684 | 48,202 |
| 30-34 | 24,879 | 28,724 | 53,604 |
| 35-39 | 34,432 | 39,186 | 73,618 |
| 40-44 | 38,746 | 42,147 | 80,893 |
| 45-49 | 38,677 | 38,695 | 77,373 |
| 50-54 | 31,501 | 28,132 | 59,633 |
| 55-59 | 17,254 | 15,917 | 33,171 |
| 60-64 | 11,460 | 13,432 | 24,892 |
| 65-69 | 9,761 | 12,790 | 22,552 |
| 70-74 | 8,741 | 12,097 | 20,839 |
| 75-79 | 5,904 | 8,882 | 14,786 |
| 80-84 | 2,736 | 5,219 | 7,955 |
| 85 Plus | 1,447 | 3,497 | 4,944 |
Goyang, Gyeonggi Province Population Density
Population Density: 2,874 / km²| Location | Population | Area | Population Density |
|---|---|---|---|
| Goyang, Gyeonggi Province | 768,374 | 267.3 km² | 2,874 / km² |
| Kyeongki-Do | 12.8 million | 10,076.9 km² | 1,275 / km² |
| South Korea | 48.8 million | 99,452.9 km² | 491.0 / km² |
Goyang, Gyeonggi Province Historical and Projected Population
Estimated Population from 1710 to 2100Sources:
1. JRC (European Commission's Joint Research Centre) work on the GHS built-up grid
2. CIESIN (Center for International Earth Science Information Network)
3. [Link] Klein Goldewijk, K., Beusen, A., Doelman, J., and Stehfest, E.: Anthropogenic land use estimates for the Holocene – HYDE 3.2, Earth Syst. Sci. Data, 9, 927–953, https://doi.org/10.5194/essd-9-927-2017, 2017.
Neighborhoods
Business Distribution by neighborhood in Goyang Ilsandong-gu: 37%
Deokyang-gu: 33.5%
Ilsanseo-gu: 24.7%
Other: 4.9%
Business distribution by price for Goyang, Gyeonggi Province
Moderate: 53.5%
Inexpensive: 42.4%
Expensive: 3.7%
Very Expensive: 0.5%
Human Development Index (HDI)
Statistic composite index of life expectancy, education, and per capita income.Sources: [Link] Kummu, M., Taka, M. & Guillaume, J. Gridded global datasets for Gross Domestic Product and Human Development Index over 1990–2015. Sci Data 5, 180004 (2018) doi:10.1038/sdata.2018.4
Goyang, Gyeonggi Province CO2 Emissions
Carbon Dioxide (CO2) Emissions Per Capita in Tonnes Per Year| Location | CO2 Emissions | CO2 Emissions Per Capita | CO2 Emissions Intensity |
|---|---|---|---|
| Goyang, Gyeonggi Province | 10,639,494 tn | 13.8 tn | 39,805 tons/km² |
| Kyeongki-Do | 161,879,218 tn | 12.6 tn | 16,064 tons/km² |
| South Korea | 595,864,161 tn | 12.2 tn | 5,991 tons/km² |
Goyang, Gyeonggi Province CO2 Emissions
| 2013 CO2 emissions (tonnes/year) | 10,639,494 tn |
| 2013 CO2 emissions (tonnes/year) per capita | 13.8 tn |
| 2013 CO2 emissions intensity (tonnes/km²/year) | 39,805 tons/km² |
Natural Hazards Risk
Relative risk out of 10| Cyclone | High (9) |
| Drought | Low (2) |
| Flood | High (8) |
* Risk, particularly concerning flood or landslide, may not be for the entire area.
Sources: 1. Dilley, M., R.S. Chen, U. Deichmann, A.L. Lerner-Lam, M. Arnold, J. Agwe, P. Buys, O. Kjekstad, B. Lyon, and G. Yetman. 2005. Natural Disaster Hotspots: A Global Risk Analysis. Washington, D.C.: World Bank. https://doi.org/10.1596/0-8213-5930-4.
2. Center for Hazards and Risk Research - CHRR - Columbia University, Center for International Earth Science Information Network - CIESIN - Columbia University. 2005. Global Flood Hazard Frequency and Distribution. Palisades, NY: NASA Socioeconomic Data and Applications Center (SEDAC). https://doi.org/10.7927/H4668B3D.
3. Center for Hazards and Risk Research - CHRR - Columbia University, Center for International Earth Science Information Network - CIESIN - Columbia University, and International Research Institute for Climate and Society - IRI - Columbia University. 2005. Global Drought Hazard Frequency and Distribution. Palisades, NY: NASA Socioeconomic Data and Applications Center (SEDAC). https://doi.org/10.7927/H4VX0DFT.
4. Center for Hazards and Risk Research - CHRR - Columbia University, Center for International Earth Science Information Network - CIESIN - Columbia University, International Bank for Reconstruction and Development - The World Bank, and United Nations Environment Programme Global Resource Information Database Geneva - UNEP/GRID-Geneva. 2005. Global Cyclone Hazard Frequency and Distribution. Palisades, NY: NASA Socioeconomic Data and Applications Center (SEDAC). https://doi.org/10.7927/H4CZ353K.
Recent Nearby Earthquakes
Magnitude 3.0 and greater
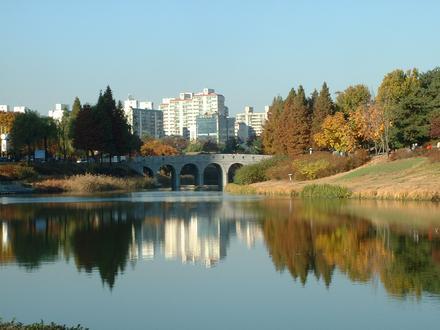
Goyang, Gyeonggi Province
Goyang city (Goyang-si; Korean pronunciation: [kojaŋ]) is located north of Seoul (the capital of South Korea), and the city can be easily accessed through Seoul Ring- Express and Jayuro Expressway within 20 minutes. The city has become an exemplary l.. Goyang Wikipedia Page
About Our Data
The data on this page is estimated using a number of publicly available tools and resources. It is provided without warranty, and could contain inaccuracies. Use at your own risk. See here for more information.